Guyanese vs Basque 10th Grade
COMPARE
Guyanese
Basque
10th Grade
10th Grade Comparison
Guyanese
Basques
91.4%
10TH GRADE
0.0/ 100
METRIC RATING
300th/ 347
METRIC RANK
94.3%
10TH GRADE
94.9/ 100
METRIC RATING
124th/ 347
METRIC RANK
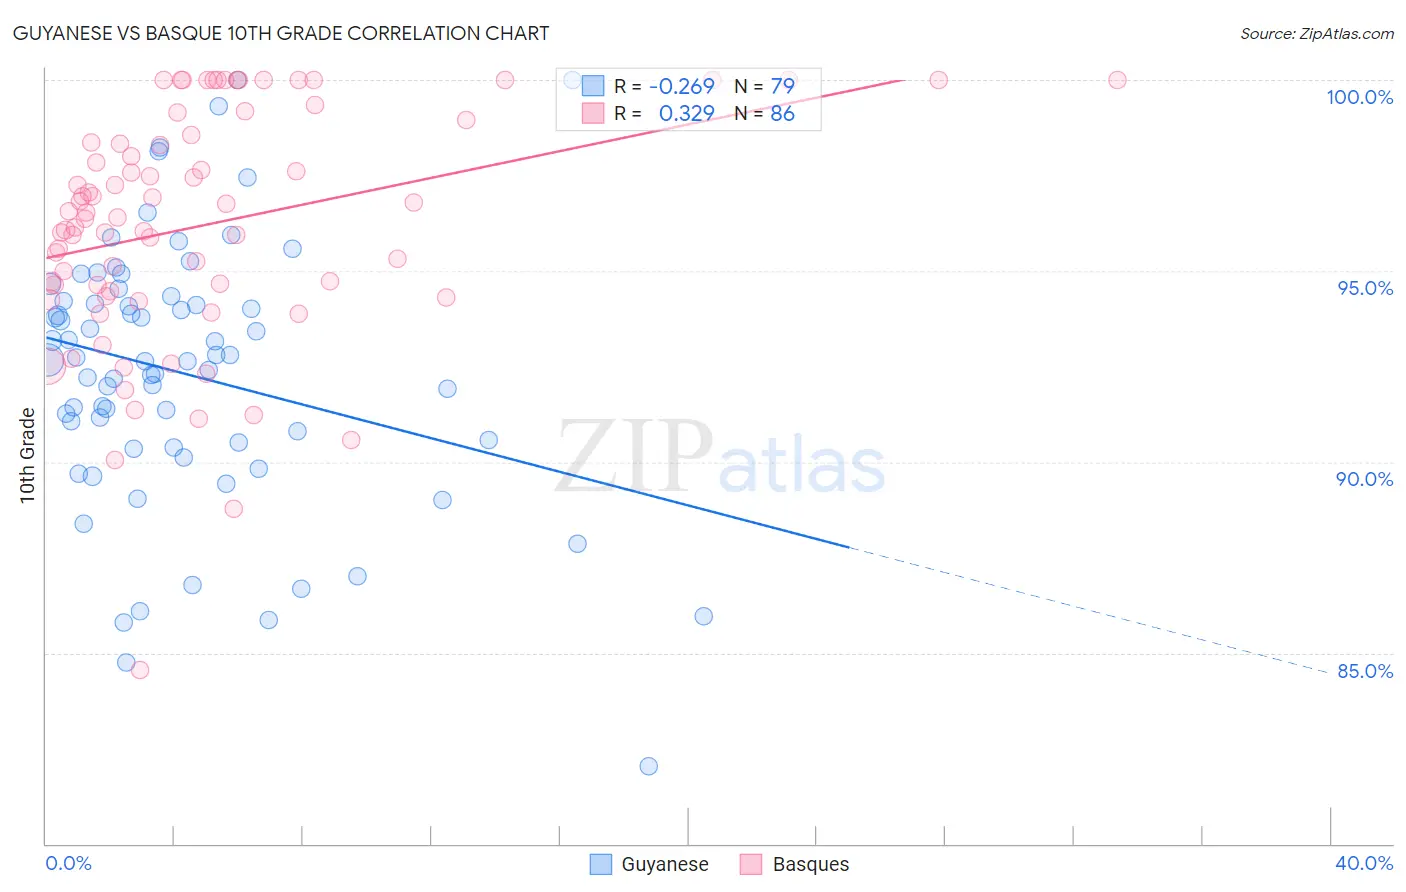
Guyanese vs Basque 10th Grade Correlation Chart
The statistical analysis conducted on geographies consisting of 176,937,226 people shows a weak negative correlation between the proportion of Guyanese and percentage of population with at least 10th grade education in the United States with a correlation coefficient (R) of -0.269 and weighted average of 91.4%. Similarly, the statistical analysis conducted on geographies consisting of 165,776,783 people shows a mild positive correlation between the proportion of Basques and percentage of population with at least 10th grade education in the United States with a correlation coefficient (R) of 0.329 and weighted average of 94.3%, a difference of 3.3%.
10th Grade Correlation Summary
| Measurement | Guyanese | Basque |
| Minimum | 82.0% | 84.6% |
| Maximum | 100.0% | 100.0% |
| Range | 18.0% | 15.4% |
| Mean | 92.3% | 96.2% |
| Median | 92.6% | 96.5% |
| Interquartile 25% (IQ1) | 90.4% | 94.5% |
| Interquartile 75% (IQ3) | 94.2% | 98.6% |
| Interquartile Range (IQR) | 3.8% | 4.1% |
| Standard Deviation (Sample) | 3.5% | 3.1% |
| Standard Deviation (Population) | 3.5% | 3.1% |
Similar Demographics by 10th Grade
Demographics Similar to Guyanese by 10th Grade
In terms of 10th grade, the demographic groups most similar to Guyanese are Immigrants from Haiti (91.4%, a difference of 0.050%), Cuban (91.5%, a difference of 0.12%), Fijian (91.5%, a difference of 0.15%), Japanese (91.2%, a difference of 0.15%), and Immigrants from Guyana (91.2%, a difference of 0.16%).
| Demographics | Rating | Rank | 10th Grade |
| Indonesians | 0.0 /100 | #293 | Tragic 91.8% |
| Haitians | 0.0 /100 | #294 | Tragic 91.8% |
| Lumbee | 0.0 /100 | #295 | Tragic 91.7% |
| Immigrants | Grenada | 0.0 /100 | #296 | Tragic 91.6% |
| Fijians | 0.0 /100 | #297 | Tragic 91.5% |
| Cubans | 0.0 /100 | #298 | Tragic 91.5% |
| Immigrants | Haiti | 0.0 /100 | #299 | Tragic 91.4% |
| Guyanese | 0.0 /100 | #300 | Tragic 91.4% |
| Japanese | 0.0 /100 | #301 | Tragic 91.2% |
| Immigrants | Guyana | 0.0 /100 | #302 | Tragic 91.2% |
| Immigrants | Vietnam | 0.0 /100 | #303 | Tragic 91.2% |
| Pima | 0.0 /100 | #304 | Tragic 91.2% |
| Immigrants | Dominica | 0.0 /100 | #305 | Tragic 91.1% |
| Yaqui | 0.0 /100 | #306 | Tragic 91.1% |
| Immigrants | Fiji | 0.0 /100 | #307 | Tragic 91.0% |
Demographics Similar to Basques by 10th Grade
In terms of 10th grade, the demographic groups most similar to Basques are Immigrants from Belarus (94.4%, a difference of 0.010%), Inupiat (94.4%, a difference of 0.010%), Cree (94.4%, a difference of 0.010%), Immigrants from Taiwan (94.4%, a difference of 0.020%), and American (94.3%, a difference of 0.020%).
| Demographics | Rating | Rank | 10th Grade |
| Immigrants | Hungary | 95.8 /100 | #117 | Exceptional 94.4% |
| Jordanians | 95.6 /100 | #118 | Exceptional 94.4% |
| Immigrants | Israel | 95.4 /100 | #119 | Exceptional 94.4% |
| Immigrants | Taiwan | 95.3 /100 | #120 | Exceptional 94.4% |
| Immigrants | Belarus | 95.2 /100 | #121 | Exceptional 94.4% |
| Inupiat | 95.1 /100 | #122 | Exceptional 94.4% |
| Cree | 95.1 /100 | #123 | Exceptional 94.4% |
| Basques | 94.9 /100 | #124 | Exceptional 94.3% |
| Americans | 94.4 /100 | #125 | Exceptional 94.3% |
| Immigrants | Iran | 94.4 /100 | #126 | Exceptional 94.3% |
| Israelis | 93.8 /100 | #127 | Exceptional 94.3% |
| Potawatomi | 93.6 /100 | #128 | Exceptional 94.3% |
| Iroquois | 92.8 /100 | #129 | Exceptional 94.3% |
| Immigrants | Greece | 92.7 /100 | #130 | Exceptional 94.3% |
| Immigrants | Eastern Europe | 92.5 /100 | #131 | Exceptional 94.3% |