Guamanian/Chamorro vs Comanche 12th Grade, No Diploma
COMPARE
Guamanian/Chamorro
Comanche
12th Grade, No Diploma
12th Grade, No Diploma Comparison
Guamanians/Chamorros
Comanche
91.0%
12TH GRADE, NO DIPLOMA
39.5/ 100
METRIC RATING
181st/ 347
METRIC RANK
89.9%
12TH GRADE, NO DIPLOMA
1.1/ 100
METRIC RATING
248th/ 347
METRIC RANK
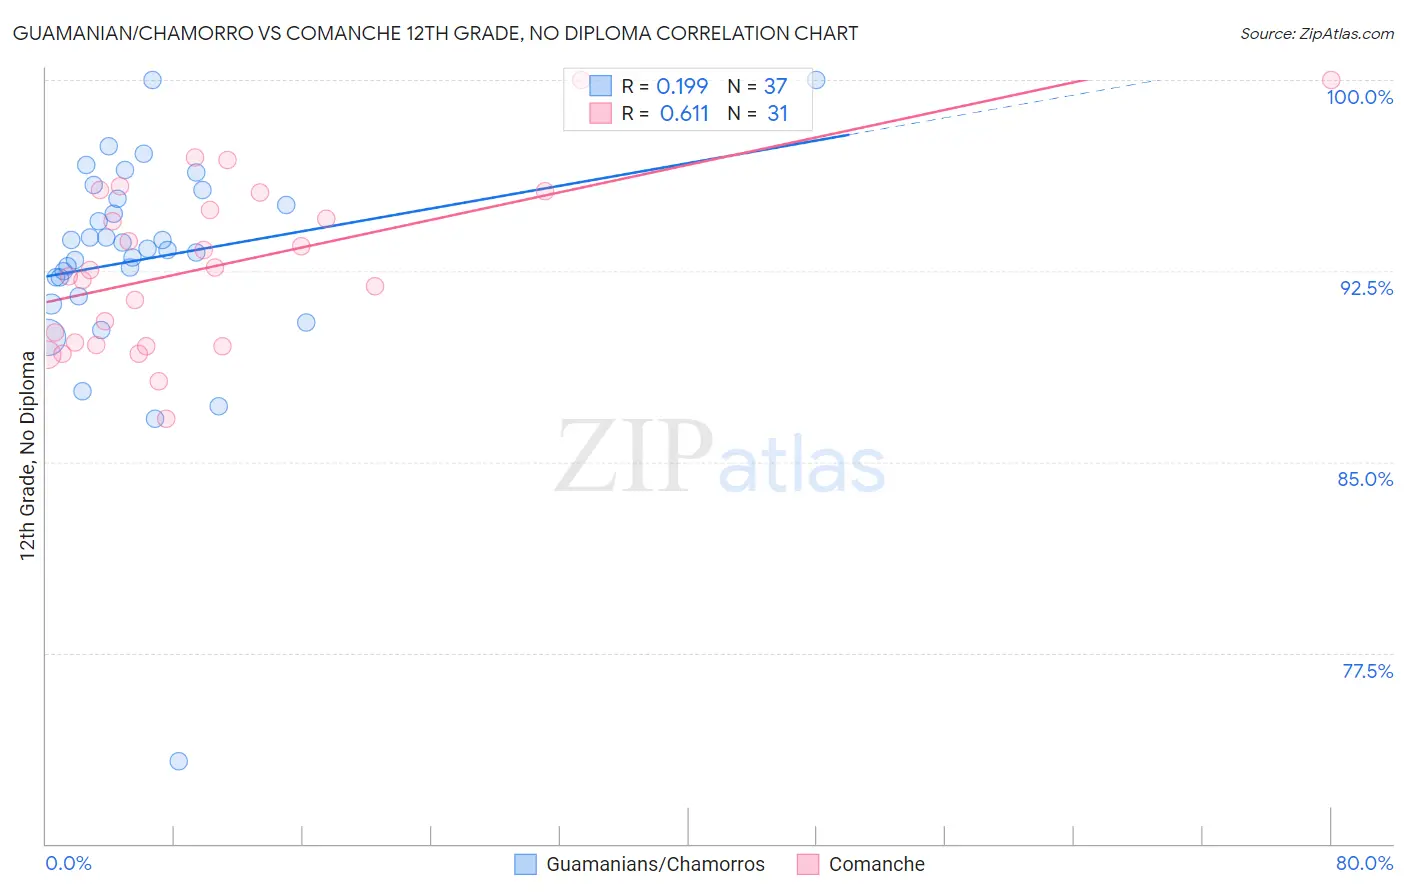
Guamanian/Chamorro vs Comanche 12th Grade, No Diploma Correlation Chart
The statistical analysis conducted on geographies consisting of 221,965,618 people shows a poor positive correlation between the proportion of Guamanians/Chamorros and percentage of population with at least 12th grade (no diploma) education in the United States with a correlation coefficient (R) of 0.199 and weighted average of 91.0%. Similarly, the statistical analysis conducted on geographies consisting of 109,786,530 people shows a significant positive correlation between the proportion of Comanche and percentage of population with at least 12th grade (no diploma) education in the United States with a correlation coefficient (R) of 0.611 and weighted average of 89.9%, a difference of 1.3%.
12th Grade, No Diploma Correlation Summary
| Measurement | Guamanian/Chamorro | Comanche |
| Minimum | 73.2% | 86.7% |
| Maximum | 100.0% | 100.0% |
| Range | 26.8% | 13.3% |
| Mean | 93.0% | 92.7% |
| Median | 93.4% | 92.5% |
| Interquartile 25% (IQ1) | 91.9% | 89.6% |
| Interquartile 75% (IQ3) | 95.5% | 95.6% |
| Interquartile Range (IQR) | 3.6% | 6.0% |
| Standard Deviation (Sample) | 4.5% | 3.4% |
| Standard Deviation (Population) | 4.4% | 3.3% |
Similar Demographics by 12th Grade, No Diploma
Demographics Similar to Guamanians/Chamorros by 12th Grade, No Diploma
In terms of 12th grade, no diploma, the demographic groups most similar to Guamanians/Chamorros are Immigrants from Syria (91.1%, a difference of 0.010%), Nonimmigrants (91.0%, a difference of 0.010%), Osage (91.0%, a difference of 0.020%), Spaniard (91.0%, a difference of 0.040%), and Spanish (91.1%, a difference of 0.050%).
| Demographics | Rating | Rank | 12th Grade, No Diploma |
| Immigrants | Nepal | 50.0 /100 | #174 | Average 91.2% |
| Immigrants | Western Asia | 49.0 /100 | #175 | Average 91.2% |
| Iroquois | 48.5 /100 | #176 | Average 91.1% |
| Sierra Leoneans | 47.7 /100 | #177 | Average 91.1% |
| Spanish | 43.7 /100 | #178 | Average 91.1% |
| Immigrants | Chile | 43.3 /100 | #179 | Average 91.1% |
| Immigrants | Syria | 40.3 /100 | #180 | Average 91.1% |
| Guamanians/Chamorros | 39.5 /100 | #181 | Fair 91.0% |
| Immigrants | Nonimmigrants | 38.8 /100 | #182 | Fair 91.0% |
| Osage | 38.3 /100 | #183 | Fair 91.0% |
| Spaniards | 36.2 /100 | #184 | Fair 91.0% |
| Sudanese | 34.4 /100 | #185 | Fair 91.0% |
| Ethiopians | 33.9 /100 | #186 | Fair 91.0% |
| Potawatomi | 32.9 /100 | #187 | Fair 91.0% |
| Americans | 32.6 /100 | #188 | Fair 91.0% |
Demographics Similar to Comanche by 12th Grade, No Diploma
In terms of 12th grade, no diploma, the demographic groups most similar to Comanche are Senegalese (89.9%, a difference of 0.0%), Immigrants from Eritrea (89.9%, a difference of 0.030%), Spanish American (89.9%, a difference of 0.040%), Immigrants from Nigeria (89.9%, a difference of 0.050%), and Bahamian (89.9%, a difference of 0.050%).
| Demographics | Rating | Rank | 12th Grade, No Diploma |
| Immigrants | Middle Africa | 1.7 /100 | #241 | Tragic 90.0% |
| Immigrants | Costa Rica | 1.6 /100 | #242 | Tragic 90.0% |
| Crow | 1.5 /100 | #243 | Tragic 90.0% |
| Taiwanese | 1.5 /100 | #244 | Tragic 90.0% |
| Immigrants | Uruguay | 1.4 /100 | #245 | Tragic 90.0% |
| Ghanaians | 1.3 /100 | #246 | Tragic 90.0% |
| Immigrants | Nigeria | 1.3 /100 | #247 | Tragic 89.9% |
| Comanche | 1.1 /100 | #248 | Tragic 89.9% |
| Senegalese | 1.1 /100 | #249 | Tragic 89.9% |
| Immigrants | Eritrea | 1.0 /100 | #250 | Tragic 89.9% |
| Spanish Americans | 0.9 /100 | #251 | Tragic 89.9% |
| Bahamians | 0.9 /100 | #252 | Tragic 89.9% |
| Choctaw | 0.7 /100 | #253 | Tragic 89.8% |
| Immigrants | Peru | 0.5 /100 | #254 | Tragic 89.7% |
| Immigrants | Senegal | 0.5 /100 | #255 | Tragic 89.7% |