Ethiopian vs Immigrants from Hungary Cognitive Disability
COMPARE
Ethiopian
Immigrants from Hungary
Cognitive Disability
Cognitive Disability Comparison
Ethiopians
Immigrants from Hungary
17.9%
COGNITIVE DISABILITY
0.5/ 100
METRIC RATING
259th/ 347
METRIC RANK
16.7%
COGNITIVE DISABILITY
99.3/ 100
METRIC RATING
77th/ 347
METRIC RANK
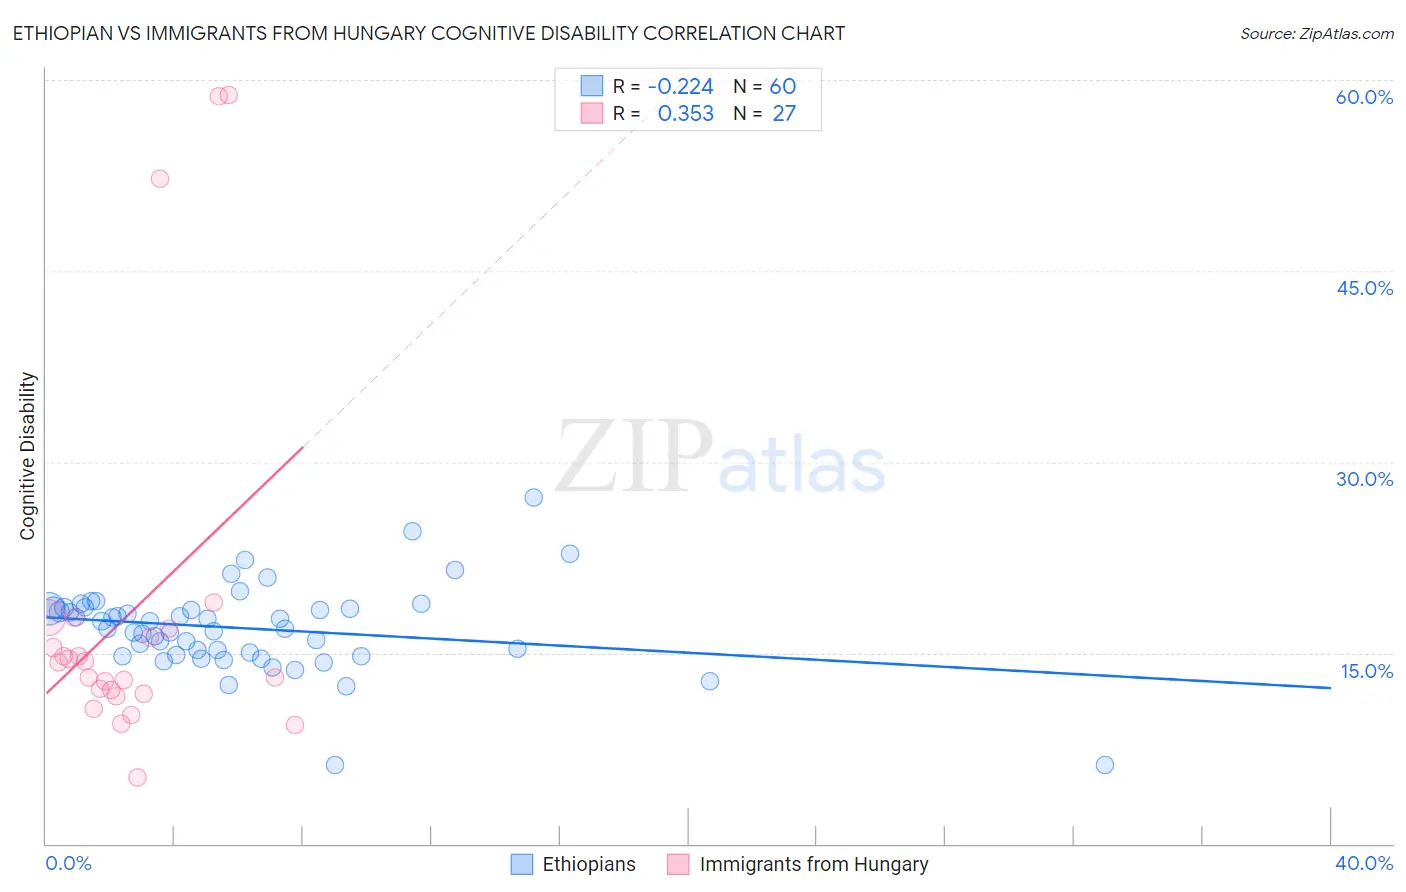
Ethiopian vs Immigrants from Hungary Cognitive Disability Correlation Chart
The statistical analysis conducted on geographies consisting of 223,243,402 people shows a weak negative correlation between the proportion of Ethiopians and percentage of population with cognitive disability in the United States with a correlation coefficient (R) of -0.224 and weighted average of 17.9%. Similarly, the statistical analysis conducted on geographies consisting of 195,708,198 people shows a mild positive correlation between the proportion of Immigrants from Hungary and percentage of population with cognitive disability in the United States with a correlation coefficient (R) of 0.353 and weighted average of 16.7%, a difference of 7.5%.
Cognitive Disability Correlation Summary
| Measurement | Ethiopian | Immigrants from Hungary |
| Minimum | 6.2% | 5.2% |
| Maximum | 27.2% | 58.8% |
| Range | 21.1% | 53.6% |
| Mean | 16.9% | 18.1% |
| Median | 17.2% | 14.2% |
| Interquartile 25% (IQ1) | 14.9% | 11.8% |
| Interquartile 75% (IQ3) | 18.5% | 16.8% |
| Interquartile Range (IQR) | 3.6% | 5.0% |
| Standard Deviation (Sample) | 3.5% | 14.2% |
| Standard Deviation (Population) | 3.4% | 13.9% |
Similar Demographics by Cognitive Disability
Demographics Similar to Ethiopians by Cognitive Disability
In terms of cognitive disability, the demographic groups most similar to Ethiopians are Immigrants from Belize (17.9%, a difference of 0.010%), Guamanian/Chamorro (17.9%, a difference of 0.060%), Immigrants from Armenia (17.9%, a difference of 0.080%), Mexican American Indian (17.9%, a difference of 0.090%), and Sierra Leonean (17.9%, a difference of 0.090%).
| Demographics | Rating | Rank | Cognitive Disability |
| Immigrants | Grenada | 0.6 /100 | #252 | Tragic 17.9% |
| Hopi | 0.6 /100 | #253 | Tragic 17.9% |
| Hispanics or Latinos | 0.6 /100 | #254 | Tragic 17.9% |
| Immigrants | Azores | 0.6 /100 | #255 | Tragic 17.9% |
| Bahamians | 0.6 /100 | #256 | Tragic 17.9% |
| Mexican American Indians | 0.6 /100 | #257 | Tragic 17.9% |
| Immigrants | Armenia | 0.6 /100 | #258 | Tragic 17.9% |
| Ethiopians | 0.5 /100 | #259 | Tragic 17.9% |
| Immigrants | Belize | 0.5 /100 | #260 | Tragic 17.9% |
| Guamanians/Chamorros | 0.5 /100 | #261 | Tragic 17.9% |
| Sierra Leoneans | 0.4 /100 | #262 | Tragic 17.9% |
| Immigrants | Barbados | 0.4 /100 | #263 | Tragic 17.9% |
| Menominee | 0.4 /100 | #264 | Tragic 18.0% |
| Spanish Americans | 0.4 /100 | #265 | Tragic 18.0% |
| Belizeans | 0.4 /100 | #266 | Tragic 18.0% |
Demographics Similar to Immigrants from Hungary by Cognitive Disability
In terms of cognitive disability, the demographic groups most similar to Immigrants from Hungary are Peruvian (16.7%, a difference of 0.0%), Immigrants from Serbia (16.7%, a difference of 0.010%), Immigrants from Bulgaria (16.7%, a difference of 0.010%), Estonian (16.7%, a difference of 0.030%), and Burmese (16.7%, a difference of 0.040%).
| Demographics | Rating | Rank | Cognitive Disability |
| Immigrants | Sweden | 99.4 /100 | #70 | Exceptional 16.7% |
| Immigrants | Belgium | 99.3 /100 | #71 | Exceptional 16.7% |
| Germans | 99.3 /100 | #72 | Exceptional 16.7% |
| Burmese | 99.3 /100 | #73 | Exceptional 16.7% |
| Slavs | 99.3 /100 | #74 | Exceptional 16.7% |
| Estonians | 99.3 /100 | #75 | Exceptional 16.7% |
| Immigrants | Serbia | 99.3 /100 | #76 | Exceptional 16.7% |
| Immigrants | Hungary | 99.3 /100 | #77 | Exceptional 16.7% |
| Peruvians | 99.3 /100 | #78 | Exceptional 16.7% |
| Immigrants | Bulgaria | 99.3 /100 | #79 | Exceptional 16.7% |
| Egyptians | 99.2 /100 | #80 | Exceptional 16.7% |
| Immigrants | Netherlands | 99.2 /100 | #81 | Exceptional 16.7% |
| Swiss | 99.2 /100 | #82 | Exceptional 16.7% |
| Serbians | 99.1 /100 | #83 | Exceptional 16.7% |
| Belgians | 99.1 /100 | #84 | Exceptional 16.7% |