Crow vs Czech Married-Couple Family Poverty
COMPARE
Crow
Czech
Married-Couple Family Poverty
Married-Couple Family Poverty Comparison
Crow
Czechs
9.6%
MARRIED-COUPLE FAMILY POVERTY
0.0/ 100
METRIC RATING
339th/ 347
METRIC RANK
4.0%
MARRIED-COUPLE FAMILY POVERTY
100.0/ 100
METRIC RATING
13th/ 347
METRIC RANK
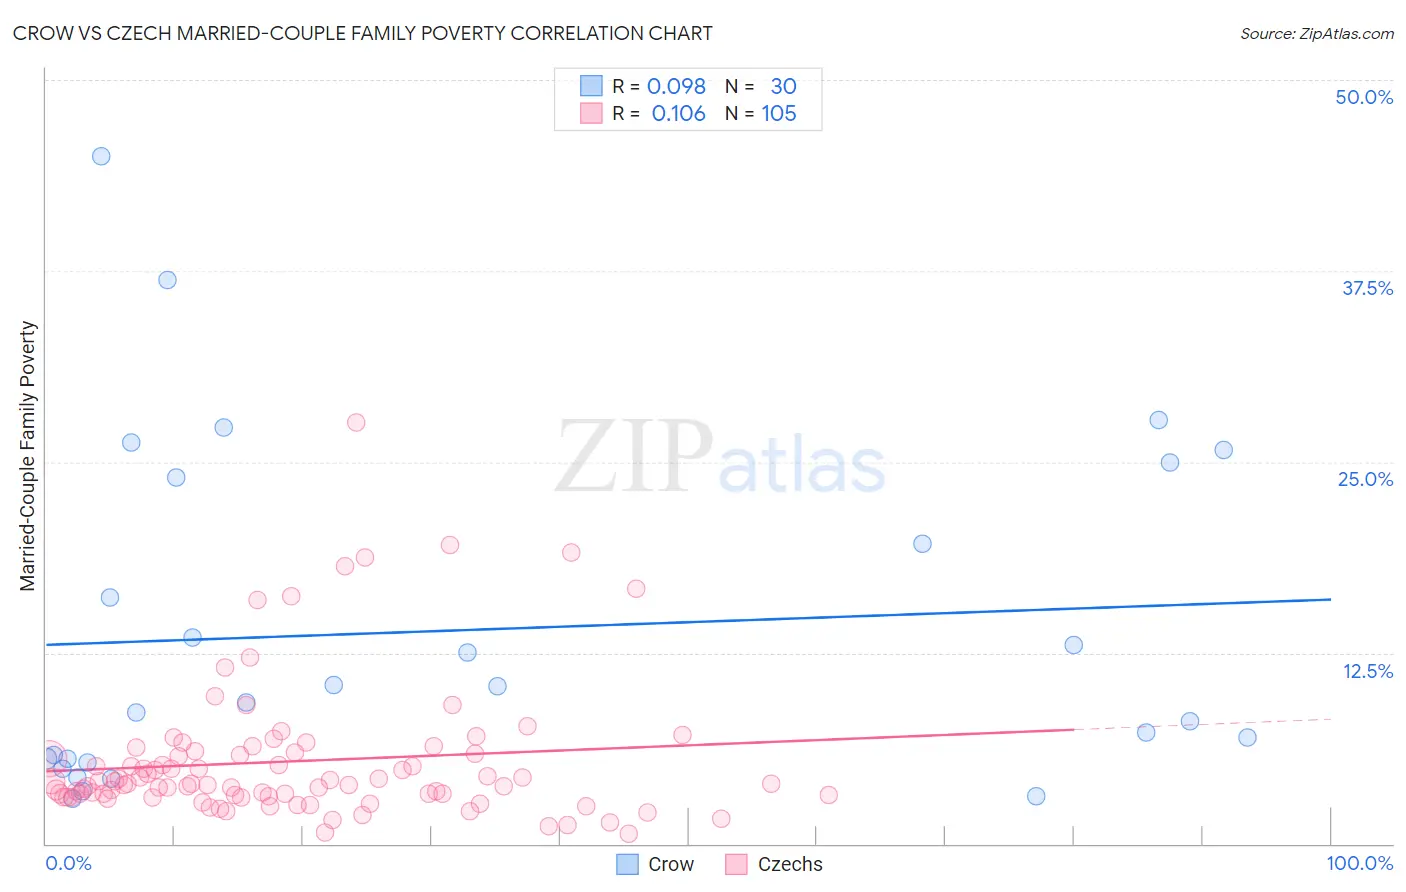
Crow vs Czech Married-Couple Family Poverty Correlation Chart
The statistical analysis conducted on geographies consisting of 59,050,450 people shows a slight positive correlation between the proportion of Crow and poverty level among married-couple families in the United States with a correlation coefficient (R) of 0.098 and weighted average of 9.6%. Similarly, the statistical analysis conducted on geographies consisting of 476,498,804 people shows a poor positive correlation between the proportion of Czechs and poverty level among married-couple families in the United States with a correlation coefficient (R) of 0.106 and weighted average of 4.0%, a difference of 137.7%.
Married-Couple Family Poverty Correlation Summary
| Measurement | Crow | Czech |
| Minimum | 2.9% | 0.69% |
| Maximum | 45.0% | 27.6% |
| Range | 42.1% | 26.9% |
| Mean | 14.0% | 5.4% |
| Median | 9.8% | 3.9% |
| Interquartile 25% (IQ1) | 5.6% | 3.1% |
| Interquartile 75% (IQ3) | 24.0% | 6.0% |
| Interquartile Range (IQR) | 18.4% | 2.9% |
| Standard Deviation (Sample) | 11.0% | 4.5% |
| Standard Deviation (Population) | 10.8% | 4.5% |
Similar Demographics by Married-Couple Family Poverty
Demographics Similar to Crow by Married-Couple Family Poverty
In terms of married-couple family poverty, the demographic groups most similar to Crow are Cheyenne (9.4%, a difference of 1.3%), Yuman (9.7%, a difference of 1.8%), Yakama (9.0%, a difference of 6.7%), Apache (9.0%, a difference of 6.8%), and Sioux (8.7%, a difference of 9.9%).
| Demographics | Rating | Rank | Married-Couple Family Poverty |
| Dominicans | 0.0 /100 | #332 | Tragic 8.3% |
| Lumbee | 0.0 /100 | #333 | Tragic 8.3% |
| Immigrants | Dominican Republic | 0.0 /100 | #334 | Tragic 8.4% |
| Sioux | 0.0 /100 | #335 | Tragic 8.7% |
| Apache | 0.0 /100 | #336 | Tragic 9.0% |
| Yakama | 0.0 /100 | #337 | Tragic 9.0% |
| Cheyenne | 0.0 /100 | #338 | Tragic 9.4% |
| Crow | 0.0 /100 | #339 | Tragic 9.6% |
| Yuman | 0.0 /100 | #340 | Tragic 9.7% |
| Pueblo | 0.0 /100 | #341 | Tragic 11.1% |
| Tohono O'odham | 0.0 /100 | #342 | Tragic 11.2% |
| Pima | 0.0 /100 | #343 | Tragic 11.4% |
| Navajo | 0.0 /100 | #344 | Tragic 11.9% |
| Puerto Ricans | 0.0 /100 | #345 | Tragic 12.6% |
| Immigrants | Yemen | 0.0 /100 | #346 | Tragic 12.8% |
Demographics Similar to Czechs by Married-Couple Family Poverty
In terms of married-couple family poverty, the demographic groups most similar to Czechs are Slovak (4.0%, a difference of 0.040%), Polish (4.0%, a difference of 0.070%), German (4.0%, a difference of 0.34%), Filipino (4.0%, a difference of 0.37%), and Italian (4.0%, a difference of 0.38%).
| Demographics | Rating | Rank | Married-Couple Family Poverty |
| Luxembourgers | 100.0 /100 | #6 | Exceptional 3.9% |
| Latvians | 100.0 /100 | #7 | Exceptional 3.9% |
| Thais | 100.0 /100 | #8 | Exceptional 3.9% |
| Croatians | 100.0 /100 | #9 | Exceptional 3.9% |
| Carpatho Rusyns | 100.0 /100 | #10 | Exceptional 3.9% |
| Lithuanians | 100.0 /100 | #11 | Exceptional 4.0% |
| Bulgarians | 100.0 /100 | #12 | Exceptional 4.0% |
| Czechs | 100.0 /100 | #13 | Exceptional 4.0% |
| Slovaks | 100.0 /100 | #14 | Exceptional 4.0% |
| Poles | 100.0 /100 | #15 | Exceptional 4.0% |
| Germans | 100.0 /100 | #16 | Exceptional 4.0% |
| Filipinos | 100.0 /100 | #17 | Exceptional 4.0% |
| Italians | 100.0 /100 | #18 | Exceptional 4.0% |
| Immigrants | Ireland | 99.9 /100 | #19 | Exceptional 4.1% |
| Maltese | 99.9 /100 | #20 | Exceptional 4.1% |