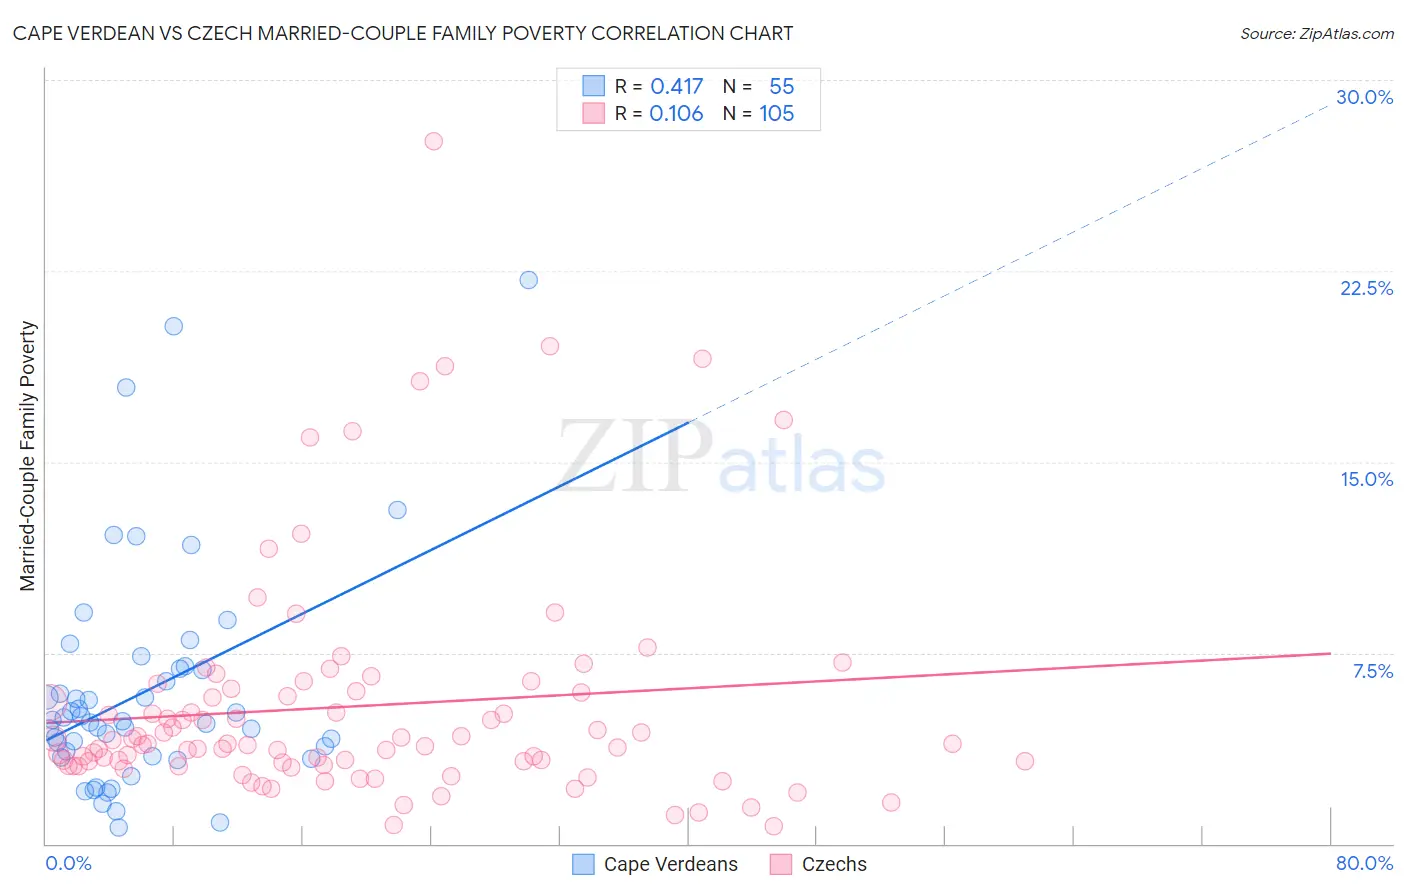
Cape Verdean vs Czech Married-Couple Family Poverty
COMPARE
Cape Verdean
Czech
Married-Couple Family Poverty
Married-Couple Family Poverty Comparison
Cape Verdeans
Czechs
5.3%
MARRIED-COUPLE FAMILY POVERTY
30.7/ 100
METRIC RATING
192nd/ 347
METRIC RANK
4.0%
MARRIED-COUPLE FAMILY POVERTY
100.0/ 100
METRIC RATING
13th/ 347
METRIC RANK
Cape Verdean vs Czech Married-Couple Family Poverty Correlation Chart
The statistical analysis conducted on geographies consisting of 107,147,993 people shows a moderate positive correlation between the proportion of Cape Verdeans and poverty level among married-couple families in the United States with a correlation coefficient (R) of 0.417 and weighted average of 5.3%. Similarly, the statistical analysis conducted on geographies consisting of 476,498,804 people shows a poor positive correlation between the proportion of Czechs and poverty level among married-couple families in the United States with a correlation coefficient (R) of 0.106 and weighted average of 4.0%, a difference of 32.8%.
Married-Couple Family Poverty Correlation Summary
| Measurement | Cape Verdean | Czech |
| Minimum | 0.66% | 0.69% |
| Maximum | 22.2% | 27.6% |
| Range | 21.5% | 26.9% |
| Mean | 6.0% | 5.4% |
| Median | 4.8% | 3.9% |
| Interquartile 25% (IQ1) | 3.4% | 3.1% |
| Interquartile 75% (IQ3) | 6.9% | 6.0% |
| Interquartile Range (IQR) | 3.4% | 2.9% |
| Standard Deviation (Sample) | 4.4% | 4.5% |
| Standard Deviation (Population) | 4.4% | 4.5% |
Similar Demographics by Married-Couple Family Poverty
Demographics Similar to Cape Verdeans by Married-Couple Family Poverty
In terms of married-couple family poverty, the demographic groups most similar to Cape Verdeans are Immigrants from Cabo Verde (5.3%, a difference of 0.030%), Ugandan (5.3%, a difference of 0.12%), Malaysian (5.4%, a difference of 0.17%), South American Indian (5.3%, a difference of 0.23%), and Israeli (5.3%, a difference of 0.32%).
| Demographics | Rating | Rank | Married-Couple Family Poverty |
| Americans | 35.4 /100 | #185 | Fair 5.3% |
| Hungarians | 34.7 /100 | #186 | Fair 5.3% |
| Immigrants | Albania | 33.8 /100 | #187 | Fair 5.3% |
| Israelis | 33.1 /100 | #188 | Fair 5.3% |
| South American Indians | 32.5 /100 | #189 | Fair 5.3% |
| Ugandans | 31.6 /100 | #190 | Fair 5.3% |
| Immigrants | Cabo Verde | 30.9 /100 | #191 | Fair 5.3% |
| Cape Verdeans | 30.7 /100 | #192 | Fair 5.3% |
| Malaysians | 29.5 /100 | #193 | Fair 5.4% |
| Immigrants | Israel | 27.8 /100 | #194 | Fair 5.4% |
| Immigrants | Azores | 27.5 /100 | #195 | Fair 5.4% |
| Spaniards | 27.4 /100 | #196 | Fair 5.4% |
| Liberians | 26.3 /100 | #197 | Fair 5.4% |
| Immigrants | Belarus | 26.2 /100 | #198 | Fair 5.4% |
| Uruguayans | 25.0 /100 | #199 | Fair 5.4% |
Demographics Similar to Czechs by Married-Couple Family Poverty
In terms of married-couple family poverty, the demographic groups most similar to Czechs are Slovak (4.0%, a difference of 0.040%), Polish (4.0%, a difference of 0.070%), German (4.0%, a difference of 0.34%), Filipino (4.0%, a difference of 0.37%), and Italian (4.0%, a difference of 0.38%).
| Demographics | Rating | Rank | Married-Couple Family Poverty |
| Luxembourgers | 100.0 /100 | #6 | Exceptional 3.9% |
| Latvians | 100.0 /100 | #7 | Exceptional 3.9% |
| Thais | 100.0 /100 | #8 | Exceptional 3.9% |
| Croatians | 100.0 /100 | #9 | Exceptional 3.9% |
| Carpatho Rusyns | 100.0 /100 | #10 | Exceptional 3.9% |
| Lithuanians | 100.0 /100 | #11 | Exceptional 4.0% |
| Bulgarians | 100.0 /100 | #12 | Exceptional 4.0% |
| Czechs | 100.0 /100 | #13 | Exceptional 4.0% |
| Slovaks | 100.0 /100 | #14 | Exceptional 4.0% |
| Poles | 100.0 /100 | #15 | Exceptional 4.0% |
| Germans | 100.0 /100 | #16 | Exceptional 4.0% |
| Filipinos | 100.0 /100 | #17 | Exceptional 4.0% |
| Italians | 100.0 /100 | #18 | Exceptional 4.0% |
| Immigrants | Ireland | 99.9 /100 | #19 | Exceptional 4.1% |
| Maltese | 99.9 /100 | #20 | Exceptional 4.1% |