Pima vs Immigrants from Nigeria Family Poverty
COMPARE
Pima
Immigrants from Nigeria
Family Poverty
Family Poverty Comparison
Pima
Immigrants from Nigeria
18.4%
FAMILY POVERTY
0.0/ 100
METRIC RATING
343rd/ 347
METRIC RANK
10.2%
FAMILY POVERTY
1.9/ 100
METRIC RATING
236th/ 347
METRIC RANK
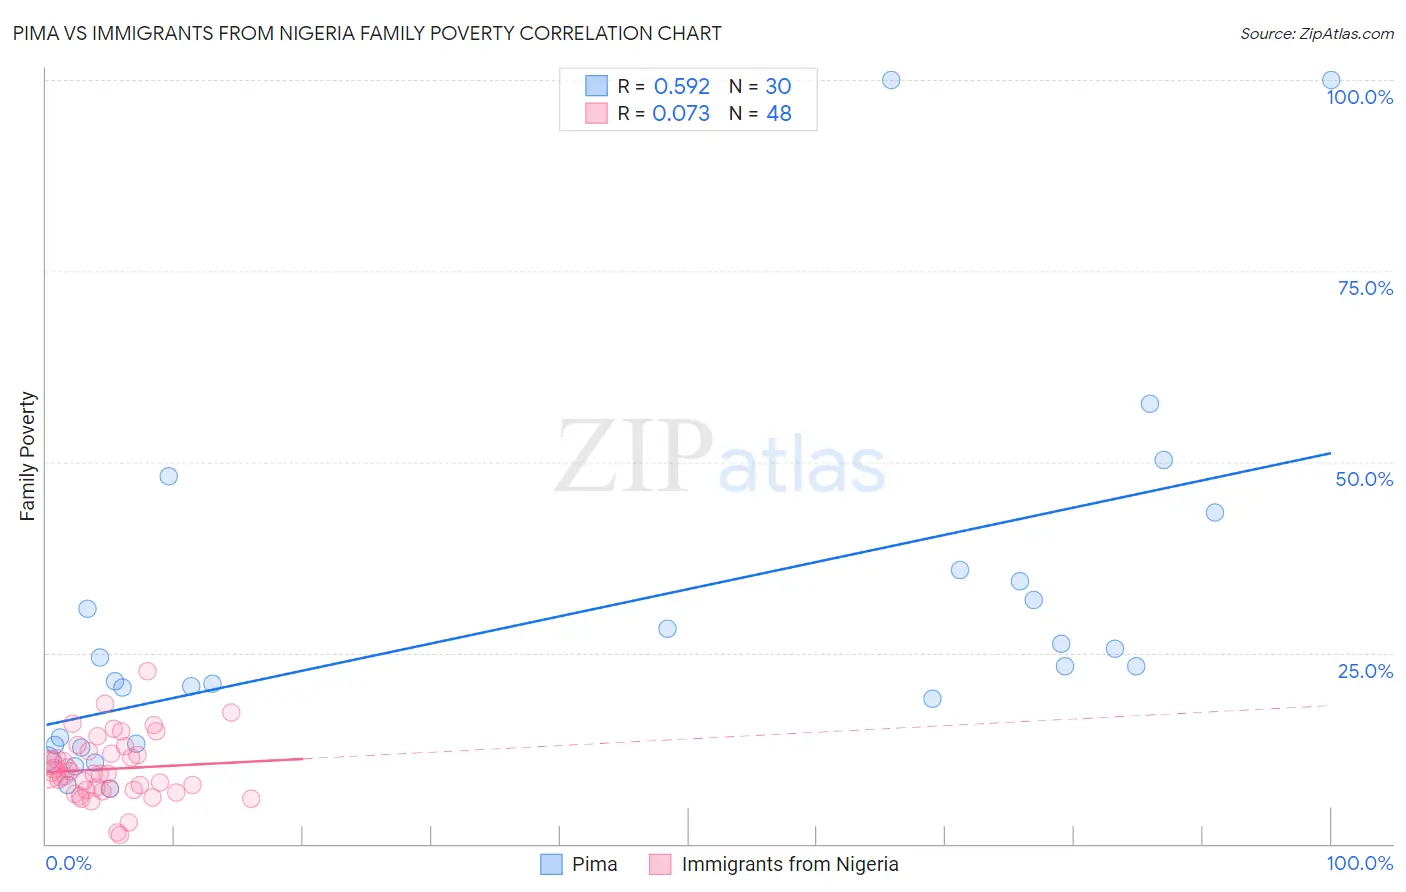
Pima vs Immigrants from Nigeria Family Poverty Correlation Chart
The statistical analysis conducted on geographies consisting of 61,531,194 people shows a substantial positive correlation between the proportion of Pima and poverty level among families in the United States with a correlation coefficient (R) of 0.592 and weighted average of 18.4%. Similarly, the statistical analysis conducted on geographies consisting of 283,018,314 people shows a slight positive correlation between the proportion of Immigrants from Nigeria and poverty level among families in the United States with a correlation coefficient (R) of 0.073 and weighted average of 10.2%, a difference of 80.6%.
Family Poverty Correlation Summary
| Measurement | Pima | Immigrants from Nigeria |
| Minimum | 7.2% | 1.2% |
| Maximum | 100.0% | 22.6% |
| Range | 92.8% | 21.4% |
| Mean | 29.5% | 9.8% |
| Median | 23.3% | 9.2% |
| Interquartile 25% (IQ1) | 13.0% | 7.1% |
| Interquartile 75% (IQ3) | 34.4% | 12.0% |
| Interquartile Range (IQR) | 21.4% | 4.9% |
| Standard Deviation (Sample) | 23.1% | 4.2% |
| Standard Deviation (Population) | 22.7% | 4.2% |
Similar Demographics by Family Poverty
Demographics Similar to Pima by Family Poverty
In terms of family poverty, the demographic groups most similar to Pima are Yup'ik (18.7%, a difference of 1.8%), Navajo (18.8%, a difference of 2.4%), Immigrants from Yemen (17.5%, a difference of 5.1%), Lumbee (17.0%, a difference of 8.0%), and Pueblo (17.0%, a difference of 8.1%).
| Demographics | Rating | Rank | Family Poverty |
| Immigrants | Dominican Republic | 0.0 /100 | #333 | Tragic 14.4% |
| Houma | 0.0 /100 | #334 | Tragic 14.6% |
| Apache | 0.0 /100 | #335 | Tragic 14.7% |
| Sioux | 0.0 /100 | #336 | Tragic 15.9% |
| Hopi | 0.0 /100 | #337 | Tragic 15.9% |
| Crow | 0.0 /100 | #338 | Tragic 16.1% |
| Yuman | 0.0 /100 | #339 | Tragic 16.6% |
| Pueblo | 0.0 /100 | #340 | Tragic 17.0% |
| Lumbee | 0.0 /100 | #341 | Tragic 17.0% |
| Immigrants | Yemen | 0.0 /100 | #342 | Tragic 17.5% |
| Pima | 0.0 /100 | #343 | Tragic 18.4% |
| Yup'ik | 0.0 /100 | #344 | Tragic 18.7% |
| Navajo | 0.0 /100 | #345 | Tragic 18.8% |
| Puerto Ricans | 0.0 /100 | #346 | Tragic 20.3% |
| Tohono O'odham | 0.0 /100 | #347 | Tragic 20.4% |
Demographics Similar to Immigrants from Nigeria by Family Poverty
In terms of family poverty, the demographic groups most similar to Immigrants from Nigeria are Nigerian (10.1%, a difference of 0.25%), Immigrants from Laos (10.2%, a difference of 0.26%), Immigrants from Middle Africa (10.1%, a difference of 0.28%), Fijian (10.1%, a difference of 0.39%), and French American Indian (10.2%, a difference of 0.63%).
| Demographics | Rating | Rank | Family Poverty |
| Immigrants | Uzbekistan | 3.1 /100 | #229 | Tragic 10.0% |
| Immigrants | Panama | 3.1 /100 | #230 | Tragic 10.0% |
| Alaskan Athabascans | 2.7 /100 | #231 | Tragic 10.1% |
| Immigrants | Sudan | 2.3 /100 | #232 | Tragic 10.1% |
| Fijians | 2.1 /100 | #233 | Tragic 10.1% |
| Immigrants | Middle Africa | 2.1 /100 | #234 | Tragic 10.1% |
| Nigerians | 2.0 /100 | #235 | Tragic 10.1% |
| Immigrants | Nigeria | 1.9 /100 | #236 | Tragic 10.2% |
| Immigrants | Laos | 1.7 /100 | #237 | Tragic 10.2% |
| French American Indians | 1.5 /100 | #238 | Tragic 10.2% |
| Potawatomi | 1.5 /100 | #239 | Tragic 10.2% |
| Immigrants | Azores | 1.4 /100 | #240 | Tragic 10.3% |
| Ghanaians | 1.3 /100 | #241 | Tragic 10.3% |
| Alaska Natives | 1.0 /100 | #242 | Tragic 10.4% |
| Nepalese | 0.8 /100 | #243 | Tragic 10.4% |