Soviet Union vs Immigrants from Nigeria Family Poverty
COMPARE
Soviet Union
Immigrants from Nigeria
Family Poverty
Family Poverty Comparison
Soviet Union
Immigrants from Nigeria
8.3%
FAMILY POVERTY
90.8/ 100
METRIC RATING
124th/ 347
METRIC RANK
10.2%
FAMILY POVERTY
1.9/ 100
METRIC RATING
236th/ 347
METRIC RANK
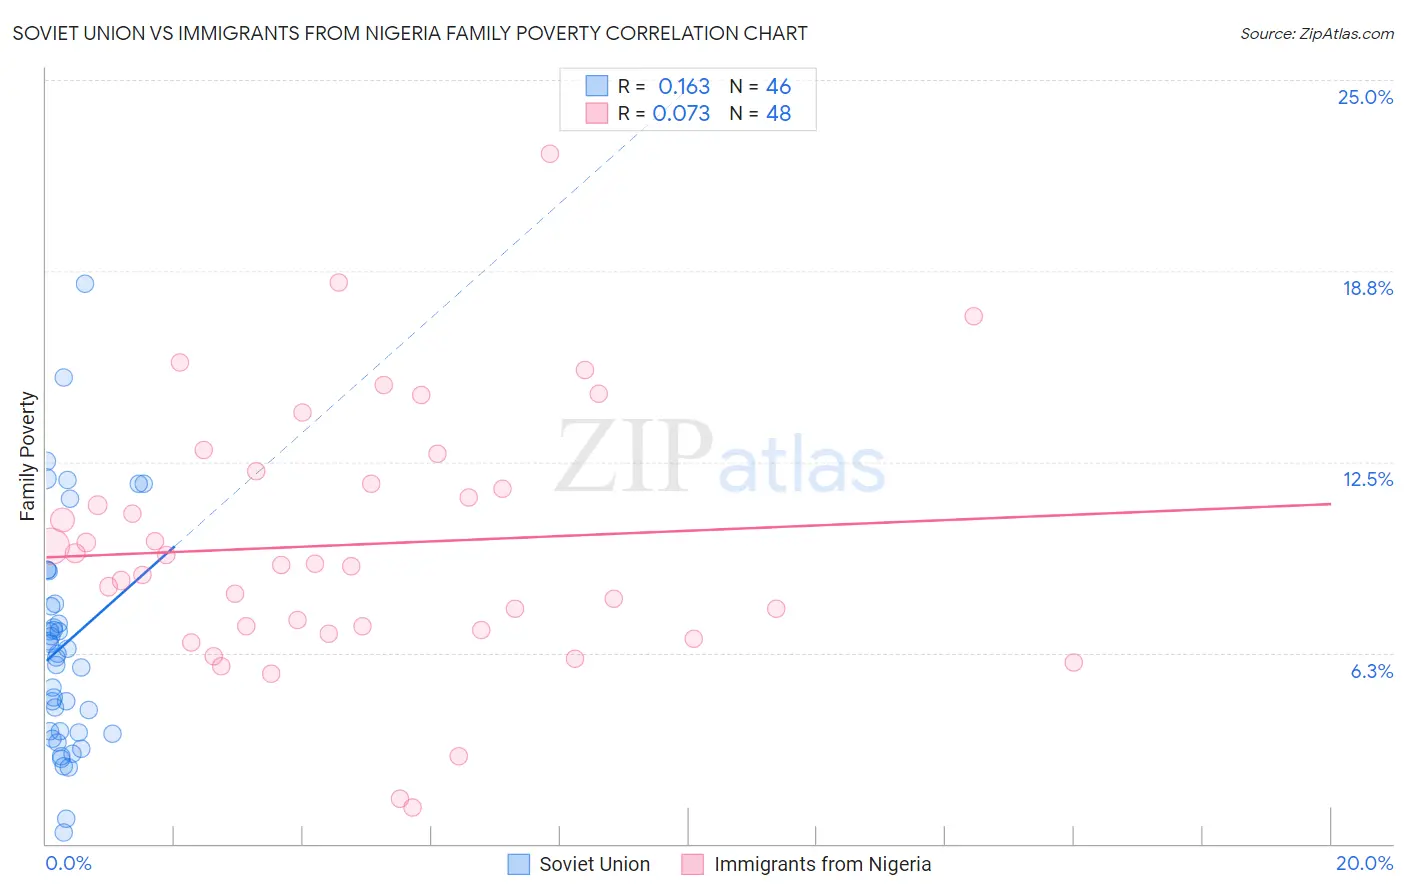
Soviet Union vs Immigrants from Nigeria Family Poverty Correlation Chart
The statistical analysis conducted on geographies consisting of 43,439,449 people shows a poor positive correlation between the proportion of Soviet Union and poverty level among families in the United States with a correlation coefficient (R) of 0.163 and weighted average of 8.3%. Similarly, the statistical analysis conducted on geographies consisting of 283,018,314 people shows a slight positive correlation between the proportion of Immigrants from Nigeria and poverty level among families in the United States with a correlation coefficient (R) of 0.073 and weighted average of 10.2%, a difference of 22.1%.
Family Poverty Correlation Summary
| Measurement | Soviet Union | Immigrants from Nigeria |
| Minimum | 0.36% | 1.2% |
| Maximum | 18.3% | 22.6% |
| Range | 18.0% | 21.4% |
| Mean | 6.5% | 9.8% |
| Median | 6.2% | 9.2% |
| Interquartile 25% (IQ1) | 3.6% | 7.1% |
| Interquartile 75% (IQ3) | 7.9% | 12.0% |
| Interquartile Range (IQR) | 4.2% | 4.9% |
| Standard Deviation (Sample) | 3.8% | 4.2% |
| Standard Deviation (Population) | 3.7% | 4.2% |
Similar Demographics by Family Poverty
Demographics Similar to Soviet Union by Family Poverty
In terms of family poverty, the demographic groups most similar to Soviet Union are Pakistani (8.3%, a difference of 0.040%), Palestinian (8.3%, a difference of 0.10%), Paraguayan (8.3%, a difference of 0.17%), Native Hawaiian (8.3%, a difference of 0.18%), and Icelander (8.3%, a difference of 0.24%).
| Demographics | Rating | Rank | Family Poverty |
| Immigrants | Russia | 93.2 /100 | #117 | Exceptional 8.2% |
| Immigrants | Western Europe | 92.9 /100 | #118 | Exceptional 8.2% |
| French | 92.8 /100 | #119 | Exceptional 8.3% |
| Immigrants | Egypt | 91.6 /100 | #120 | Exceptional 8.3% |
| Native Hawaiians | 91.3 /100 | #121 | Exceptional 8.3% |
| Paraguayans | 91.2 /100 | #122 | Exceptional 8.3% |
| Palestinians | 91.1 /100 | #123 | Exceptional 8.3% |
| Soviet Union | 90.8 /100 | #124 | Exceptional 8.3% |
| Pakistanis | 90.8 /100 | #125 | Exceptional 8.3% |
| Icelanders | 90.3 /100 | #126 | Exceptional 8.3% |
| Immigrants | Hungary | 89.9 /100 | #127 | Excellent 8.4% |
| Argentineans | 89.6 /100 | #128 | Excellent 8.4% |
| Portuguese | 89.2 /100 | #129 | Excellent 8.4% |
| Immigrants | Bosnia and Herzegovina | 88.6 /100 | #130 | Excellent 8.4% |
| Puget Sound Salish | 88.6 /100 | #131 | Excellent 8.4% |
Demographics Similar to Immigrants from Nigeria by Family Poverty
In terms of family poverty, the demographic groups most similar to Immigrants from Nigeria are Nigerian (10.1%, a difference of 0.25%), Immigrants from Laos (10.2%, a difference of 0.26%), Immigrants from Middle Africa (10.1%, a difference of 0.28%), Fijian (10.1%, a difference of 0.39%), and French American Indian (10.2%, a difference of 0.63%).
| Demographics | Rating | Rank | Family Poverty |
| Immigrants | Uzbekistan | 3.1 /100 | #229 | Tragic 10.0% |
| Immigrants | Panama | 3.1 /100 | #230 | Tragic 10.0% |
| Alaskan Athabascans | 2.7 /100 | #231 | Tragic 10.1% |
| Immigrants | Sudan | 2.3 /100 | #232 | Tragic 10.1% |
| Fijians | 2.1 /100 | #233 | Tragic 10.1% |
| Immigrants | Middle Africa | 2.1 /100 | #234 | Tragic 10.1% |
| Nigerians | 2.0 /100 | #235 | Tragic 10.1% |
| Immigrants | Nigeria | 1.9 /100 | #236 | Tragic 10.2% |
| Immigrants | Laos | 1.7 /100 | #237 | Tragic 10.2% |
| French American Indians | 1.5 /100 | #238 | Tragic 10.2% |
| Potawatomi | 1.5 /100 | #239 | Tragic 10.2% |
| Immigrants | Azores | 1.4 /100 | #240 | Tragic 10.3% |
| Ghanaians | 1.3 /100 | #241 | Tragic 10.3% |
| Alaska Natives | 1.0 /100 | #242 | Tragic 10.4% |
| Nepalese | 0.8 /100 | #243 | Tragic 10.4% |