Cherokee vs Immigrants from Zimbabwe Single Male Poverty
COMPARE
Cherokee
Immigrants from Zimbabwe
Single Male Poverty
Single Male Poverty Comparison
Cherokee
Immigrants from Zimbabwe
16.1%
SINGLE MALE POVERTY
0.0/ 100
METRIC RATING
313th/ 347
METRIC RANK
12.6%
SINGLE MALE POVERTY
78.0/ 100
METRIC RATING
140th/ 347
METRIC RANK
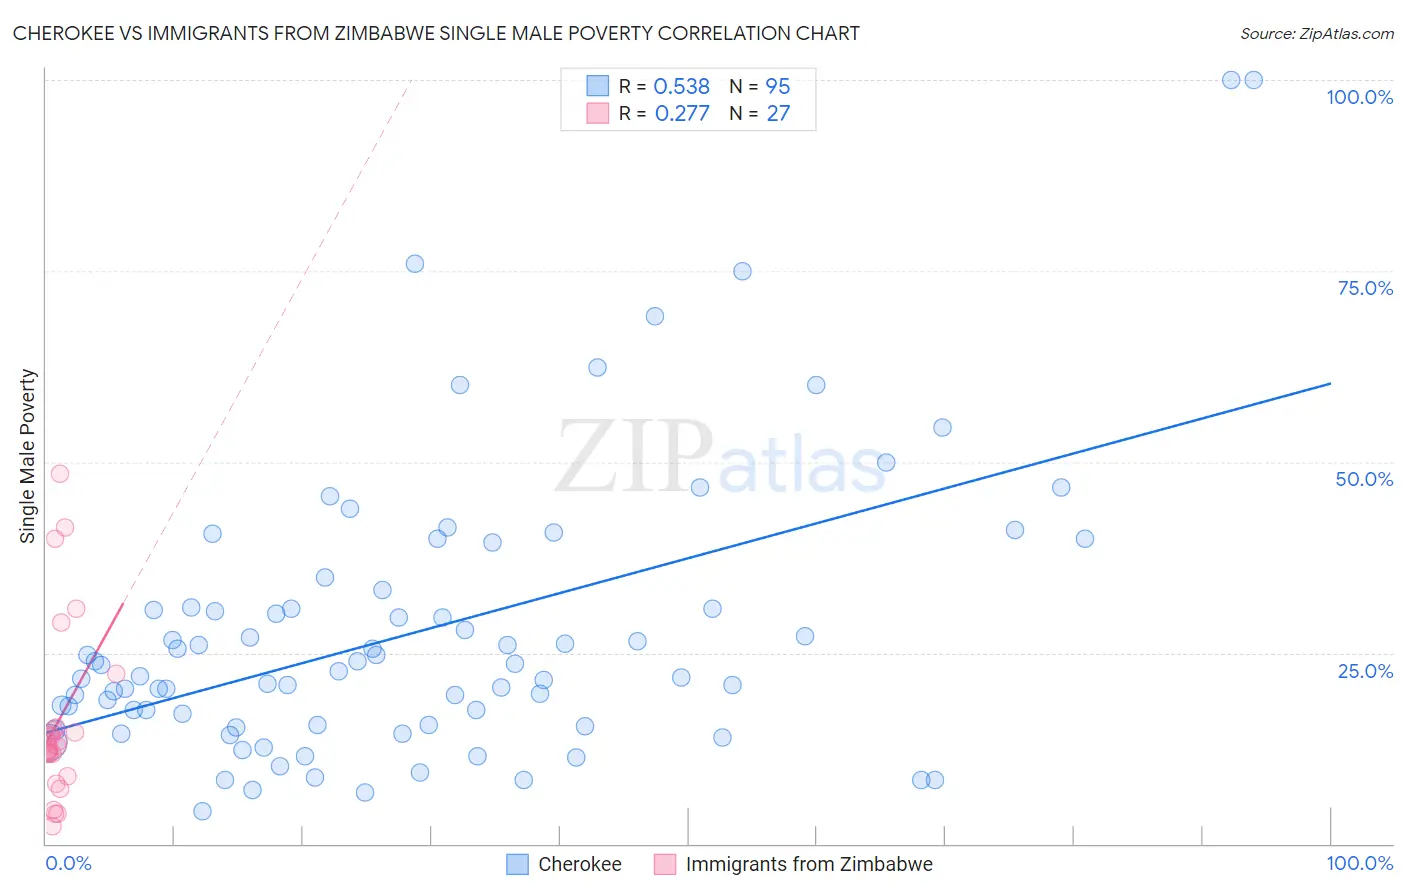
Cherokee vs Immigrants from Zimbabwe Single Male Poverty Correlation Chart
The statistical analysis conducted on geographies consisting of 428,758,235 people shows a substantial positive correlation between the proportion of Cherokee and poverty level among single males in the United States with a correlation coefficient (R) of 0.538 and weighted average of 16.1%. Similarly, the statistical analysis conducted on geographies consisting of 112,161,655 people shows a weak positive correlation between the proportion of Immigrants from Zimbabwe and poverty level among single males in the United States with a correlation coefficient (R) of 0.277 and weighted average of 12.6%, a difference of 27.6%.
Single Male Poverty Correlation Summary
| Measurement | Cherokee | Immigrants from Zimbabwe |
| Minimum | 4.3% | 2.3% |
| Maximum | 100.0% | 48.4% |
| Range | 95.7% | 46.1% |
| Mean | 27.7% | 16.1% |
| Median | 22.6% | 12.7% |
| Interquartile 25% (IQ1) | 15.5% | 8.9% |
| Interquartile 75% (IQ3) | 30.9% | 15.3% |
| Interquartile Range (IQR) | 15.4% | 6.4% |
| Standard Deviation (Sample) | 18.5% | 11.8% |
| Standard Deviation (Population) | 18.4% | 11.6% |
Similar Demographics by Single Male Poverty
Demographics Similar to Cherokee by Single Male Poverty
In terms of single male poverty, the demographic groups most similar to Cherokee are Seminole (16.0%, a difference of 0.23%), Comanche (16.0%, a difference of 0.23%), Alaskan Athabascan (16.1%, a difference of 0.29%), Cheyenne (16.1%, a difference of 0.33%), and Dutch West Indian (16.1%, a difference of 0.48%).
| Demographics | Rating | Rank | Single Male Poverty |
| Pennsylvania Germans | 0.0 /100 | #306 | Tragic 15.6% |
| Ute | 0.0 /100 | #307 | Tragic 15.7% |
| Potawatomi | 0.0 /100 | #308 | Tragic 15.8% |
| Americans | 0.0 /100 | #309 | Tragic 15.8% |
| Yakama | 0.0 /100 | #310 | Tragic 15.9% |
| Seminole | 0.0 /100 | #311 | Tragic 16.0% |
| Comanche | 0.0 /100 | #312 | Tragic 16.0% |
| Cherokee | 0.0 /100 | #313 | Tragic 16.1% |
| Alaskan Athabascans | 0.0 /100 | #314 | Tragic 16.1% |
| Cheyenne | 0.0 /100 | #315 | Tragic 16.1% |
| Dutch West Indians | 0.0 /100 | #316 | Tragic 16.1% |
| Blacks/African Americans | 0.0 /100 | #317 | Tragic 16.2% |
| Chickasaw | 0.0 /100 | #318 | Tragic 16.3% |
| Chippewa | 0.0 /100 | #319 | Tragic 16.4% |
| Marshallese | 0.0 /100 | #320 | Tragic 16.4% |
Demographics Similar to Immigrants from Zimbabwe by Single Male Poverty
In terms of single male poverty, the demographic groups most similar to Immigrants from Zimbabwe are Cuban (12.6%, a difference of 0.15%), Immigrants from El Salvador (12.6%, a difference of 0.16%), Okinawan (12.6%, a difference of 0.16%), Immigrants from Uganda (12.6%, a difference of 0.16%), and Immigrants from France (12.6%, a difference of 0.17%).
| Demographics | Rating | Rank | Single Male Poverty |
| Immigrants | Western Asia | 83.4 /100 | #133 | Excellent 12.5% |
| Immigrants | Ecuador | 82.1 /100 | #134 | Excellent 12.5% |
| Immigrants | Costa Rica | 81.9 /100 | #135 | Excellent 12.5% |
| Immigrants | Austria | 81.9 /100 | #136 | Excellent 12.5% |
| Ukrainians | 80.7 /100 | #137 | Excellent 12.6% |
| Immigrants | El Salvador | 80.0 /100 | #138 | Excellent 12.6% |
| Cubans | 79.9 /100 | #139 | Good 12.6% |
| Immigrants | Zimbabwe | 78.0 /100 | #140 | Good 12.6% |
| Okinawans | 75.9 /100 | #141 | Good 12.6% |
| Immigrants | Uganda | 75.9 /100 | #142 | Good 12.6% |
| Immigrants | France | 75.8 /100 | #143 | Good 12.6% |
| Hawaiians | 75.1 /100 | #144 | Good 12.6% |
| Immigrants | Lebanon | 75.0 /100 | #145 | Good 12.6% |
| Native Hawaiians | 75.0 /100 | #146 | Good 12.6% |
| Malaysians | 74.8 /100 | #147 | Good 12.6% |