Immigrants from Brazil vs Immigrants from Zimbabwe Female Poverty
COMPARE
Immigrants from Brazil
Immigrants from Zimbabwe
Female Poverty
Female Poverty Comparison
Immigrants from Brazil
Immigrants from Zimbabwe
12.8%
FEMALE POVERTY
87.9/ 100
METRIC RATING
129th/ 347
METRIC RANK
12.6%
FEMALE POVERTY
93.1/ 100
METRIC RATING
109th/ 347
METRIC RANK
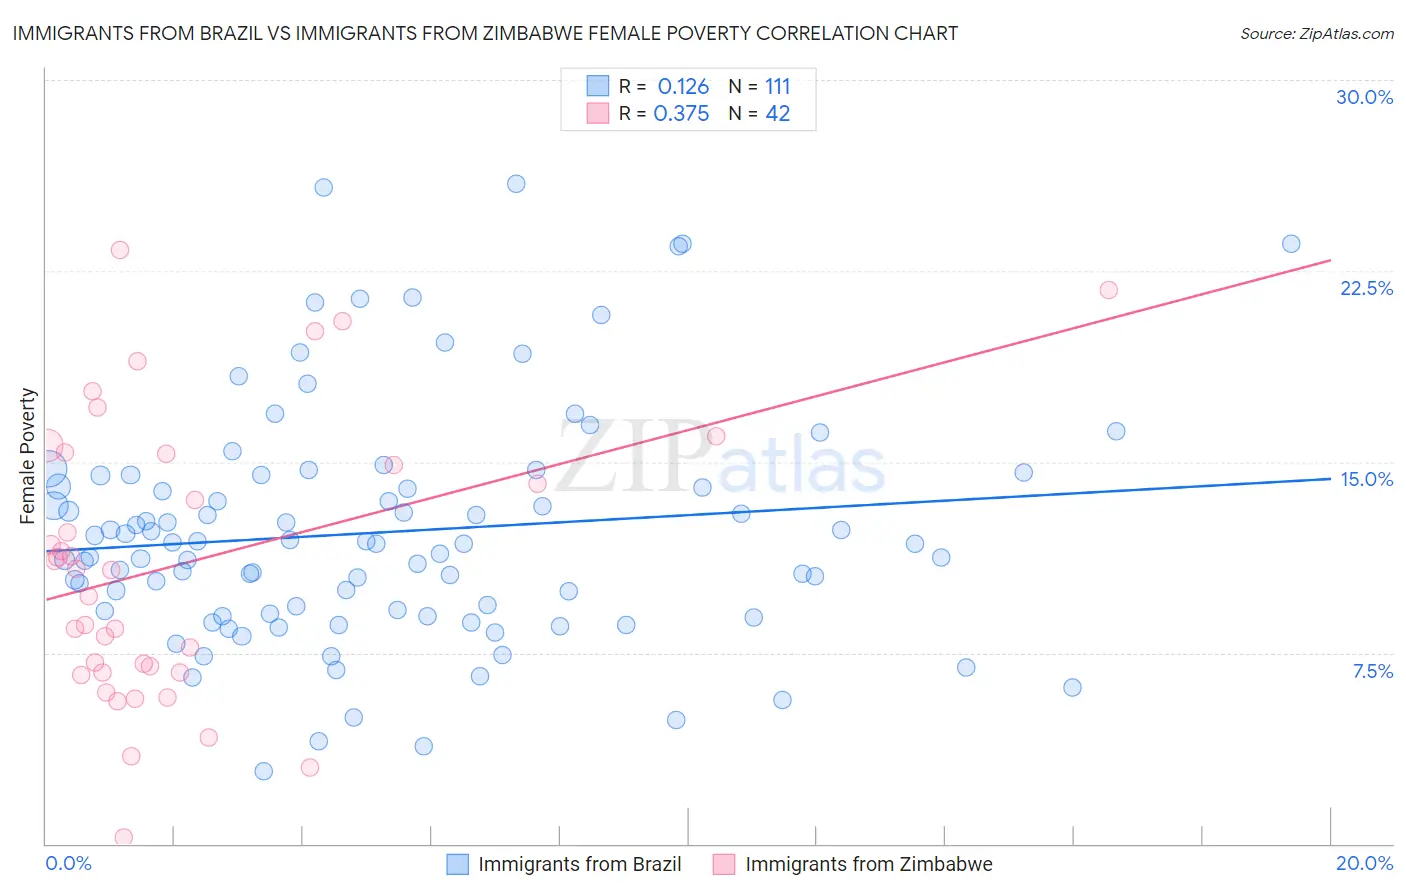
Immigrants from Brazil vs Immigrants from Zimbabwe Female Poverty Correlation Chart
The statistical analysis conducted on geographies consisting of 342,799,416 people shows a poor positive correlation between the proportion of Immigrants from Brazil and poverty level among females in the United States with a correlation coefficient (R) of 0.126 and weighted average of 12.8%. Similarly, the statistical analysis conducted on geographies consisting of 117,784,385 people shows a mild positive correlation between the proportion of Immigrants from Zimbabwe and poverty level among females in the United States with a correlation coefficient (R) of 0.375 and weighted average of 12.6%, a difference of 1.6%.
Female Poverty Correlation Summary
| Measurement | Immigrants from Brazil | Immigrants from Zimbabwe |
| Minimum | 2.9% | 0.23% |
| Maximum | 25.9% | 23.3% |
| Range | 23.1% | 23.1% |
| Mean | 12.2% | 11.0% |
| Median | 11.8% | 10.8% |
| Interquartile 25% (IQ1) | 9.0% | 6.7% |
| Interquartile 75% (IQ3) | 14.5% | 15.3% |
| Interquartile Range (IQR) | 5.4% | 8.6% |
| Standard Deviation (Sample) | 4.6% | 5.5% |
| Standard Deviation (Population) | 4.6% | 5.4% |
Demographics Similar to Immigrants from Brazil and Immigrants from Zimbabwe by Female Poverty
In terms of female poverty, the demographic groups most similar to Immigrants from Brazil are Immigrants from Belarus (12.8%, a difference of 0.070%), South African (12.8%, a difference of 0.11%), Immigrants from Ukraine (12.8%, a difference of 0.22%), Argentinean (12.8%, a difference of 0.29%), and Immigrants from Norway (12.8%, a difference of 0.34%). Similarly, the demographic groups most similar to Immigrants from Zimbabwe are Paraguayan (12.6%, a difference of 0.030%), Soviet Union (12.6%, a difference of 0.25%), Immigrants from Israel (12.6%, a difference of 0.39%), Canadian (12.7%, a difference of 0.42%), and Welsh (12.7%, a difference of 0.54%).
| Demographics | Rating | Rank | Female Poverty |
| Immigrants | Zimbabwe | 93.1 /100 | #109 | Exceptional 12.6% |
| Paraguayans | 93.0 /100 | #110 | Exceptional 12.6% |
| Soviet Union | 92.4 /100 | #111 | Exceptional 12.6% |
| Immigrants | Israel | 92.0 /100 | #112 | Exceptional 12.6% |
| Canadians | 92.0 /100 | #113 | Exceptional 12.7% |
| Welsh | 91.6 /100 | #114 | Exceptional 12.7% |
| Puget Sound Salish | 91.5 /100 | #115 | Exceptional 12.7% |
| Immigrants | Russia | 91.2 /100 | #116 | Exceptional 12.7% |
| Immigrants | Southern Europe | 90.9 /100 | #117 | Exceptional 12.7% |
| Sri Lankans | 90.9 /100 | #118 | Exceptional 12.7% |
| Albanians | 90.8 /100 | #119 | Exceptional 12.7% |
| New Zealanders | 90.6 /100 | #120 | Exceptional 12.7% |
| Immigrants | Hungary | 90.3 /100 | #121 | Exceptional 12.7% |
| French Canadians | 90.2 /100 | #122 | Exceptional 12.7% |
| Immigrants | South Eastern Asia | 89.9 /100 | #123 | Excellent 12.7% |
| Immigrants | Norway | 89.3 /100 | #124 | Excellent 12.8% |
| Argentineans | 89.1 /100 | #125 | Excellent 12.8% |
| Immigrants | Ukraine | 88.8 /100 | #126 | Excellent 12.8% |
| South Africans | 88.4 /100 | #127 | Excellent 12.8% |
| Immigrants | Belarus | 88.2 /100 | #128 | Excellent 12.8% |
| Immigrants | Brazil | 87.9 /100 | #129 | Excellent 12.8% |