Cherokee vs Dutch West Indian Associate's Degree
COMPARE
Cherokee
Dutch West Indian
Associate's Degree
Associate's Degree Comparison
Cherokee
Dutch West Indians
38.9%
ASSOCIATE'S DEGREE
0.0/ 100
METRIC RATING
296th/ 347
METRIC RANK
36.5%
ASSOCIATE'S DEGREE
0.0/ 100
METRIC RATING
327th/ 347
METRIC RANK
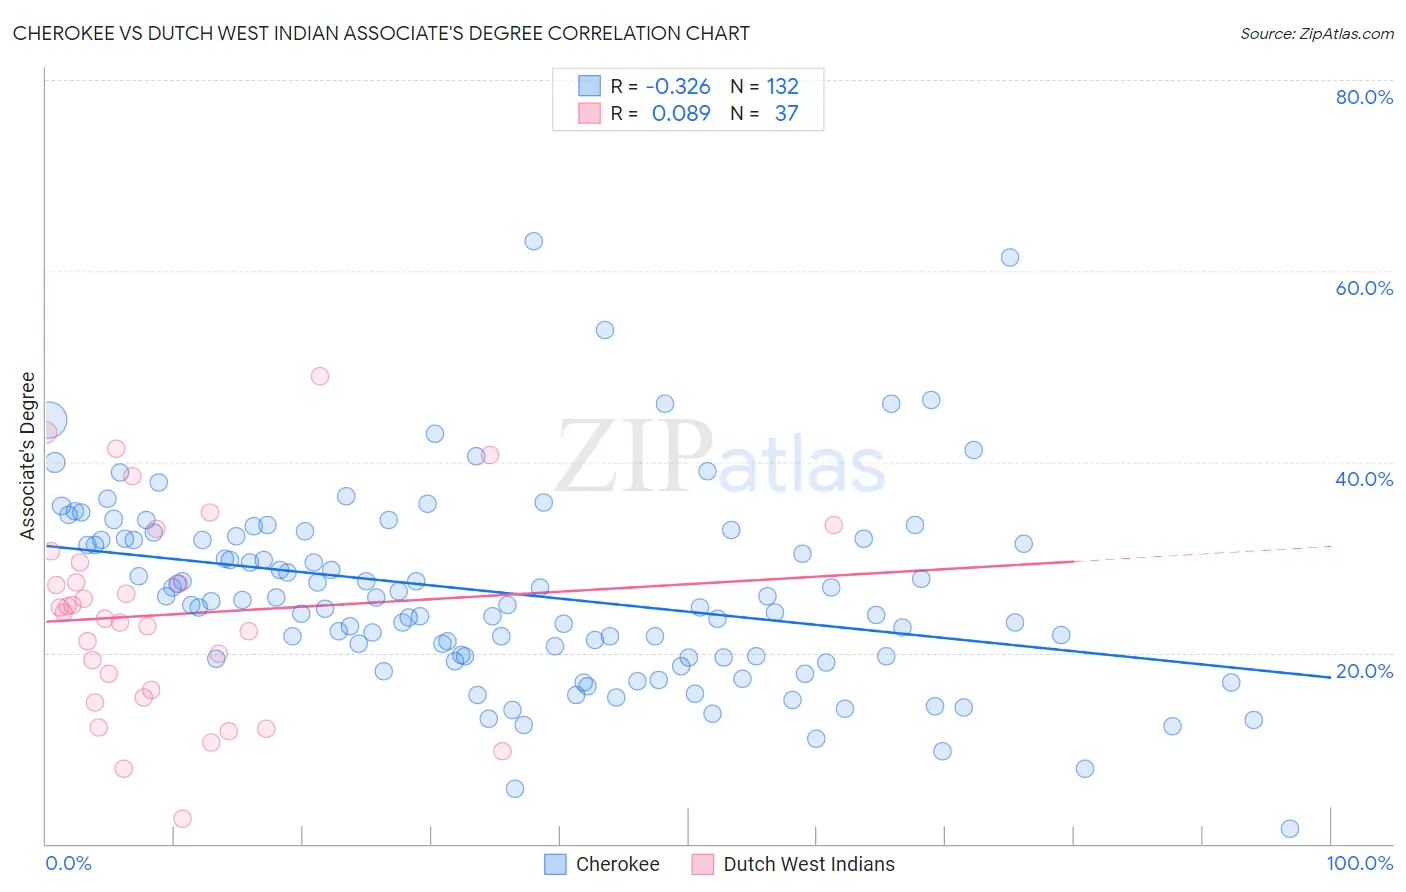
Cherokee vs Dutch West Indian Associate's Degree Correlation Chart
The statistical analysis conducted on geographies consisting of 493,690,336 people shows a mild negative correlation between the proportion of Cherokee and percentage of population with at least associate's degree education in the United States with a correlation coefficient (R) of -0.326 and weighted average of 38.9%. Similarly, the statistical analysis conducted on geographies consisting of 85,775,630 people shows a slight positive correlation between the proportion of Dutch West Indians and percentage of population with at least associate's degree education in the United States with a correlation coefficient (R) of 0.089 and weighted average of 36.5%, a difference of 6.6%.
Associate's Degree Correlation Summary
| Measurement | Cherokee | Dutch West Indian |
| Minimum | 1.6% | 2.6% |
| Maximum | 63.1% | 49.0% |
| Range | 61.4% | 46.3% |
| Mean | 26.2% | 24.0% |
| Median | 25.3% | 24.3% |
| Interquartile 25% (IQ1) | 19.6% | 15.7% |
| Interquartile 75% (IQ3) | 31.9% | 30.1% |
| Interquartile Range (IQR) | 12.3% | 14.3% |
| Standard Deviation (Sample) | 10.0% | 10.6% |
| Standard Deviation (Population) | 10.0% | 10.4% |
Similar Demographics by Associate's Degree
Demographics Similar to Cherokee by Associate's Degree
In terms of associate's degree, the demographic groups most similar to Cherokee are Honduran (38.9%, a difference of 0.17%), Cape Verdean (38.8%, a difference of 0.28%), Nepalese (39.0%, a difference of 0.46%), Salvadoran (39.0%, a difference of 0.46%), and Cheyenne (38.7%, a difference of 0.55%).
| Demographics | Rating | Rank | Associate's Degree |
| Central Americans | 0.0 /100 | #289 | Tragic 39.4% |
| Immigrants | Haiti | 0.0 /100 | #290 | Tragic 39.3% |
| Dominicans | 0.0 /100 | #291 | Tragic 39.3% |
| Blacks/African Americans | 0.0 /100 | #292 | Tragic 39.1% |
| Nepalese | 0.0 /100 | #293 | Tragic 39.0% |
| Salvadorans | 0.0 /100 | #294 | Tragic 39.0% |
| Hondurans | 0.0 /100 | #295 | Tragic 38.9% |
| Cherokee | 0.0 /100 | #296 | Tragic 38.9% |
| Cape Verdeans | 0.0 /100 | #297 | Tragic 38.8% |
| Cheyenne | 0.0 /100 | #298 | Tragic 38.7% |
| Ute | 0.0 /100 | #299 | Tragic 38.6% |
| Chickasaw | 0.0 /100 | #300 | Tragic 38.6% |
| Tsimshian | 0.0 /100 | #301 | Tragic 38.6% |
| Colville | 0.0 /100 | #302 | Tragic 38.5% |
| Guatemalans | 0.0 /100 | #303 | Tragic 38.5% |
Demographics Similar to Dutch West Indians by Associate's Degree
In terms of associate's degree, the demographic groups most similar to Dutch West Indians are Alaskan Athabascan (36.5%, a difference of 0.010%), Kiowa (36.5%, a difference of 0.020%), Paiute (36.4%, a difference of 0.30%), Menominee (36.7%, a difference of 0.58%), and Apache (36.2%, a difference of 0.61%).
| Demographics | Rating | Rank | Associate's Degree |
| Cajuns | 0.0 /100 | #320 | Tragic 37.4% |
| Immigrants | Yemen | 0.0 /100 | #321 | Tragic 37.3% |
| Pennsylvania Germans | 0.0 /100 | #322 | Tragic 37.2% |
| Immigrants | Cabo Verde | 0.0 /100 | #323 | Tragic 36.8% |
| Arapaho | 0.0 /100 | #324 | Tragic 36.7% |
| Menominee | 0.0 /100 | #325 | Tragic 36.7% |
| Kiowa | 0.0 /100 | #326 | Tragic 36.5% |
| Dutch West Indians | 0.0 /100 | #327 | Tragic 36.5% |
| Alaskan Athabascans | 0.0 /100 | #328 | Tragic 36.5% |
| Paiute | 0.0 /100 | #329 | Tragic 36.4% |
| Apache | 0.0 /100 | #330 | Tragic 36.2% |
| Immigrants | Azores | 0.0 /100 | #331 | Tragic 35.6% |
| Immigrants | Central America | 0.0 /100 | #332 | Tragic 35.0% |
| Mexicans | 0.0 /100 | #333 | Tragic 35.0% |
| Natives/Alaskans | 0.0 /100 | #334 | Tragic 34.9% |