Comanche vs Dutch West Indian Female Poverty
COMPARE
Comanche
Dutch West Indian
Female Poverty
Female Poverty Comparison
Comanche
Dutch West Indians
16.2%
FEMALE POVERTY
0.0/ 100
METRIC RATING
285th/ 347
METRIC RANK
17.1%
FEMALE POVERTY
0.0/ 100
METRIC RATING
314th/ 347
METRIC RANK
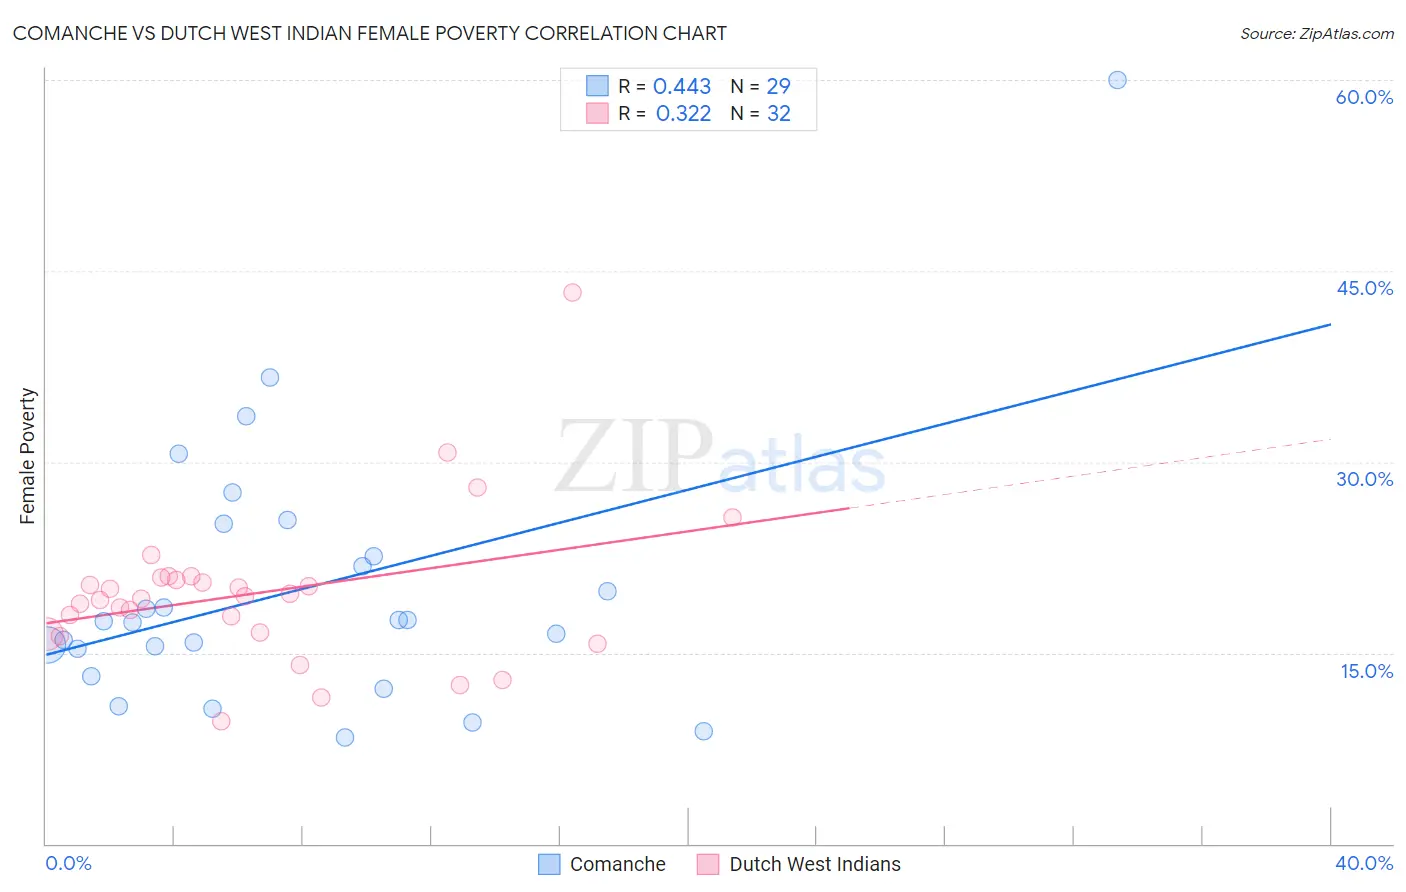
Comanche vs Dutch West Indian Female Poverty Correlation Chart
The statistical analysis conducted on geographies consisting of 109,749,855 people shows a moderate positive correlation between the proportion of Comanche and poverty level among females in the United States with a correlation coefficient (R) of 0.443 and weighted average of 16.2%. Similarly, the statistical analysis conducted on geographies consisting of 85,761,145 people shows a mild positive correlation between the proportion of Dutch West Indians and poverty level among females in the United States with a correlation coefficient (R) of 0.322 and weighted average of 17.1%, a difference of 5.6%.
Female Poverty Correlation Summary
| Measurement | Comanche | Dutch West Indian |
| Minimum | 8.4% | 9.6% |
| Maximum | 60.0% | 43.3% |
| Range | 51.6% | 33.7% |
| Mean | 20.0% | 19.7% |
| Median | 17.4% | 19.3% |
| Interquartile 25% (IQ1) | 14.3% | 16.5% |
| Interquartile 75% (IQ3) | 23.9% | 20.8% |
| Interquartile Range (IQR) | 9.6% | 4.3% |
| Standard Deviation (Sample) | 10.5% | 6.1% |
| Standard Deviation (Population) | 10.3% | 6.0% |
Similar Demographics by Female Poverty
Demographics Similar to Comanche by Female Poverty
In terms of female poverty, the demographic groups most similar to Comanche are Spanish American (16.2%, a difference of 0.080%), Immigrants from Cuba (16.1%, a difference of 0.13%), Immigrants from Haiti (16.1%, a difference of 0.21%), West Indian (16.1%, a difference of 0.36%), and Vietnamese (16.1%, a difference of 0.38%).
| Demographics | Rating | Rank | Female Poverty |
| Immigrants | West Indies | 0.0 /100 | #278 | Tragic 16.1% |
| Immigrants | Bahamas | 0.0 /100 | #279 | Tragic 16.1% |
| Vietnamese | 0.0 /100 | #280 | Tragic 16.1% |
| West Indians | 0.0 /100 | #281 | Tragic 16.1% |
| Immigrants | Haiti | 0.0 /100 | #282 | Tragic 16.1% |
| Immigrants | Cuba | 0.0 /100 | #283 | Tragic 16.1% |
| Spanish Americans | 0.0 /100 | #284 | Tragic 16.2% |
| Comanche | 0.0 /100 | #285 | Tragic 16.2% |
| Inupiat | 0.0 /100 | #286 | Tragic 16.2% |
| Immigrants | Belize | 0.0 /100 | #287 | Tragic 16.3% |
| Indonesians | 0.0 /100 | #288 | Tragic 16.4% |
| Blackfeet | 0.0 /100 | #289 | Tragic 16.4% |
| Immigrants | Bangladesh | 0.0 /100 | #290 | Tragic 16.4% |
| Yaqui | 0.0 /100 | #291 | Tragic 16.4% |
| Immigrants | Zaire | 0.0 /100 | #292 | Tragic 16.4% |
Demographics Similar to Dutch West Indians by Female Poverty
In terms of female poverty, the demographic groups most similar to Dutch West Indians are British West Indian (17.0%, a difference of 0.25%), Immigrants from Somalia (17.0%, a difference of 0.33%), Creek (17.0%, a difference of 0.42%), Immigrants from Guatemala (17.0%, a difference of 0.42%), and Immigrants from Mexico (17.0%, a difference of 0.67%).
| Demographics | Rating | Rank | Female Poverty |
| Seminole | 0.0 /100 | #307 | Tragic 16.9% |
| Africans | 0.0 /100 | #308 | Tragic 16.9% |
| Immigrants | Mexico | 0.0 /100 | #309 | Tragic 17.0% |
| Creek | 0.0 /100 | #310 | Tragic 17.0% |
| Immigrants | Guatemala | 0.0 /100 | #311 | Tragic 17.0% |
| Immigrants | Somalia | 0.0 /100 | #312 | Tragic 17.0% |
| British West Indians | 0.0 /100 | #313 | Tragic 17.0% |
| Dutch West Indians | 0.0 /100 | #314 | Tragic 17.1% |
| U.S. Virgin Islanders | 0.0 /100 | #315 | Tragic 17.3% |
| Hondurans | 0.0 /100 | #316 | Tragic 17.4% |
| Immigrants | Congo | 0.0 /100 | #317 | Tragic 17.4% |
| Ute | 0.0 /100 | #318 | Tragic 17.5% |
| Cajuns | 0.0 /100 | #319 | Tragic 17.5% |
| Immigrants | Dominica | 0.0 /100 | #320 | Tragic 17.5% |
| Arapaho | 0.0 /100 | #321 | Tragic 17.5% |