Immigrants from Singapore vs Dutch West Indian Female Poverty
COMPARE
Immigrants from Singapore
Dutch West Indian
Female Poverty
Female Poverty Comparison
Immigrants from Singapore
Dutch West Indians
11.8%
FEMALE POVERTY
99.4/ 100
METRIC RATING
34th/ 347
METRIC RANK
17.1%
FEMALE POVERTY
0.0/ 100
METRIC RATING
314th/ 347
METRIC RANK
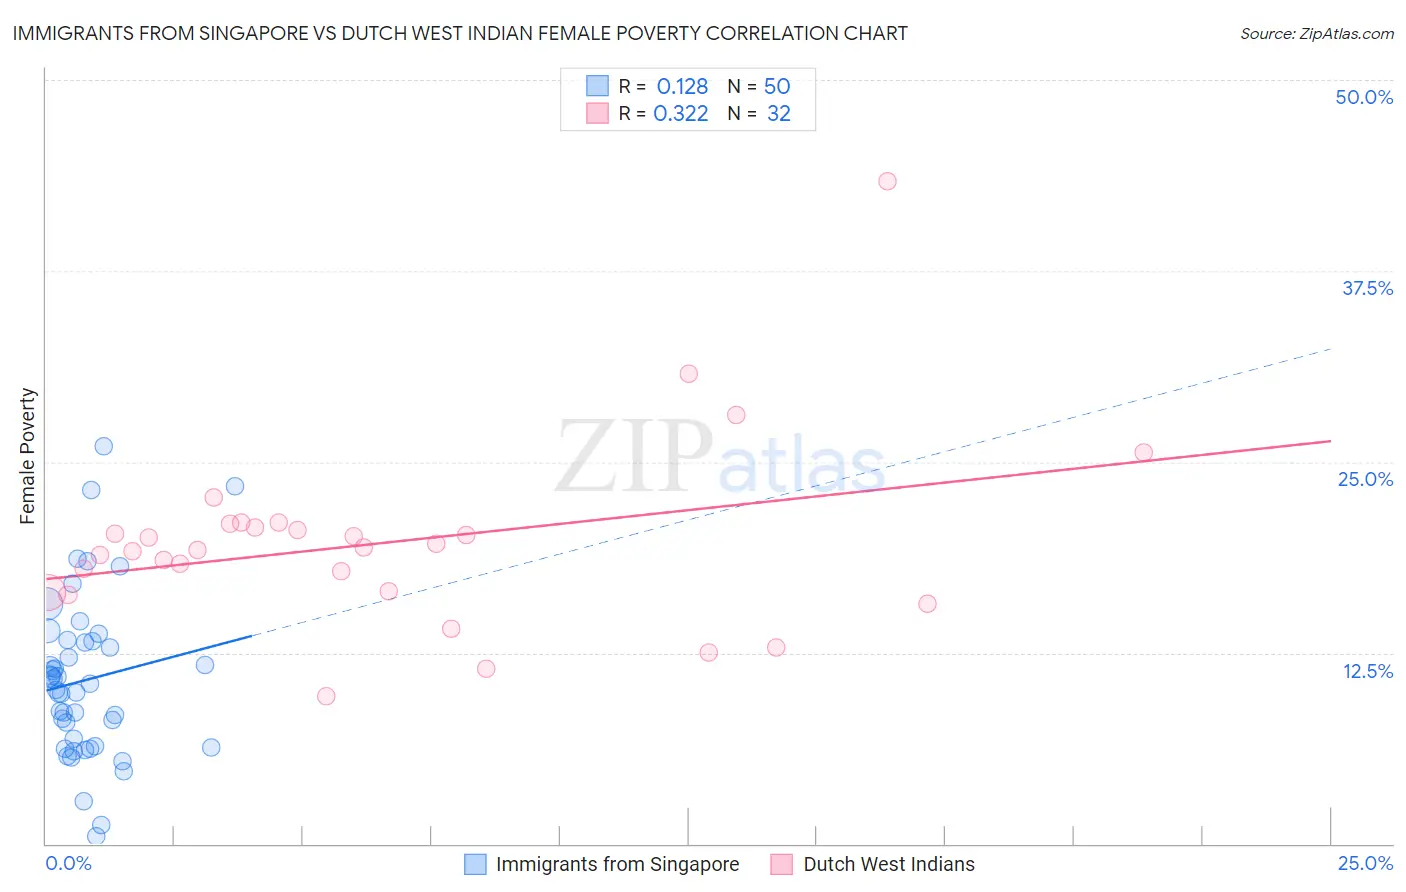
Immigrants from Singapore vs Dutch West Indian Female Poverty Correlation Chart
The statistical analysis conducted on geographies consisting of 137,378,092 people shows a poor positive correlation between the proportion of Immigrants from Singapore and poverty level among females in the United States with a correlation coefficient (R) of 0.128 and weighted average of 11.8%. Similarly, the statistical analysis conducted on geographies consisting of 85,761,145 people shows a mild positive correlation between the proportion of Dutch West Indians and poverty level among females in the United States with a correlation coefficient (R) of 0.322 and weighted average of 17.1%, a difference of 45.1%.
Female Poverty Correlation Summary
| Measurement | Immigrants from Singapore | Dutch West Indian |
| Minimum | 0.53% | 9.6% |
| Maximum | 26.0% | 43.3% |
| Range | 25.5% | 33.7% |
| Mean | 10.7% | 19.7% |
| Median | 10.3% | 19.3% |
| Interquartile 25% (IQ1) | 6.4% | 16.5% |
| Interquartile 75% (IQ3) | 13.2% | 20.8% |
| Interquartile Range (IQR) | 6.9% | 4.3% |
| Standard Deviation (Sample) | 5.4% | 6.1% |
| Standard Deviation (Population) | 5.3% | 6.0% |
Similar Demographics by Female Poverty
Demographics Similar to Immigrants from Singapore by Female Poverty
In terms of female poverty, the demographic groups most similar to Immigrants from Singapore are Cypriot (11.8%, a difference of 0.12%), Immigrants from Iran (11.8%, a difference of 0.17%), Danish (11.7%, a difference of 0.19%), Polish (11.7%, a difference of 0.32%), and Immigrants from Pakistan (11.8%, a difference of 0.34%).
| Demographics | Rating | Rank | Female Poverty |
| Iranians | 99.6 /100 | #27 | Exceptional 11.7% |
| Immigrants | Korea | 99.6 /100 | #28 | Exceptional 11.7% |
| Immigrants | North Macedonia | 99.6 /100 | #29 | Exceptional 11.7% |
| Greeks | 99.5 /100 | #30 | Exceptional 11.7% |
| Poles | 99.5 /100 | #31 | Exceptional 11.7% |
| Danes | 99.5 /100 | #32 | Exceptional 11.7% |
| Cypriots | 99.5 /100 | #33 | Exceptional 11.8% |
| Immigrants | Singapore | 99.4 /100 | #34 | Exceptional 11.8% |
| Immigrants | Iran | 99.4 /100 | #35 | Exceptional 11.8% |
| Immigrants | Pakistan | 99.4 /100 | #36 | Exceptional 11.8% |
| Immigrants | Greece | 99.3 /100 | #37 | Exceptional 11.8% |
| Russians | 99.3 /100 | #38 | Exceptional 11.8% |
| Immigrants | Poland | 99.3 /100 | #39 | Exceptional 11.8% |
| Macedonians | 99.3 /100 | #40 | Exceptional 11.8% |
| Czechs | 99.2 /100 | #41 | Exceptional 11.9% |
Demographics Similar to Dutch West Indians by Female Poverty
In terms of female poverty, the demographic groups most similar to Dutch West Indians are British West Indian (17.0%, a difference of 0.25%), Immigrants from Somalia (17.0%, a difference of 0.33%), Creek (17.0%, a difference of 0.42%), Immigrants from Guatemala (17.0%, a difference of 0.42%), and Immigrants from Mexico (17.0%, a difference of 0.67%).
| Demographics | Rating | Rank | Female Poverty |
| Seminole | 0.0 /100 | #307 | Tragic 16.9% |
| Africans | 0.0 /100 | #308 | Tragic 16.9% |
| Immigrants | Mexico | 0.0 /100 | #309 | Tragic 17.0% |
| Creek | 0.0 /100 | #310 | Tragic 17.0% |
| Immigrants | Guatemala | 0.0 /100 | #311 | Tragic 17.0% |
| Immigrants | Somalia | 0.0 /100 | #312 | Tragic 17.0% |
| British West Indians | 0.0 /100 | #313 | Tragic 17.0% |
| Dutch West Indians | 0.0 /100 | #314 | Tragic 17.1% |
| U.S. Virgin Islanders | 0.0 /100 | #315 | Tragic 17.3% |
| Hondurans | 0.0 /100 | #316 | Tragic 17.4% |
| Immigrants | Congo | 0.0 /100 | #317 | Tragic 17.4% |
| Ute | 0.0 /100 | #318 | Tragic 17.5% |
| Cajuns | 0.0 /100 | #319 | Tragic 17.5% |
| Immigrants | Dominica | 0.0 /100 | #320 | Tragic 17.5% |
| Arapaho | 0.0 /100 | #321 | Tragic 17.5% |