Immigrants from Dominican Republic vs Dutch West Indian Female Poverty
COMPARE
Immigrants from Dominican Republic
Dutch West Indian
Female Poverty
Female Poverty Comparison
Immigrants from Dominican Republic
Dutch West Indians
19.3%
FEMALE POVERTY
0.0/ 100
METRIC RATING
333rd/ 347
METRIC RANK
17.1%
FEMALE POVERTY
0.0/ 100
METRIC RATING
314th/ 347
METRIC RANK
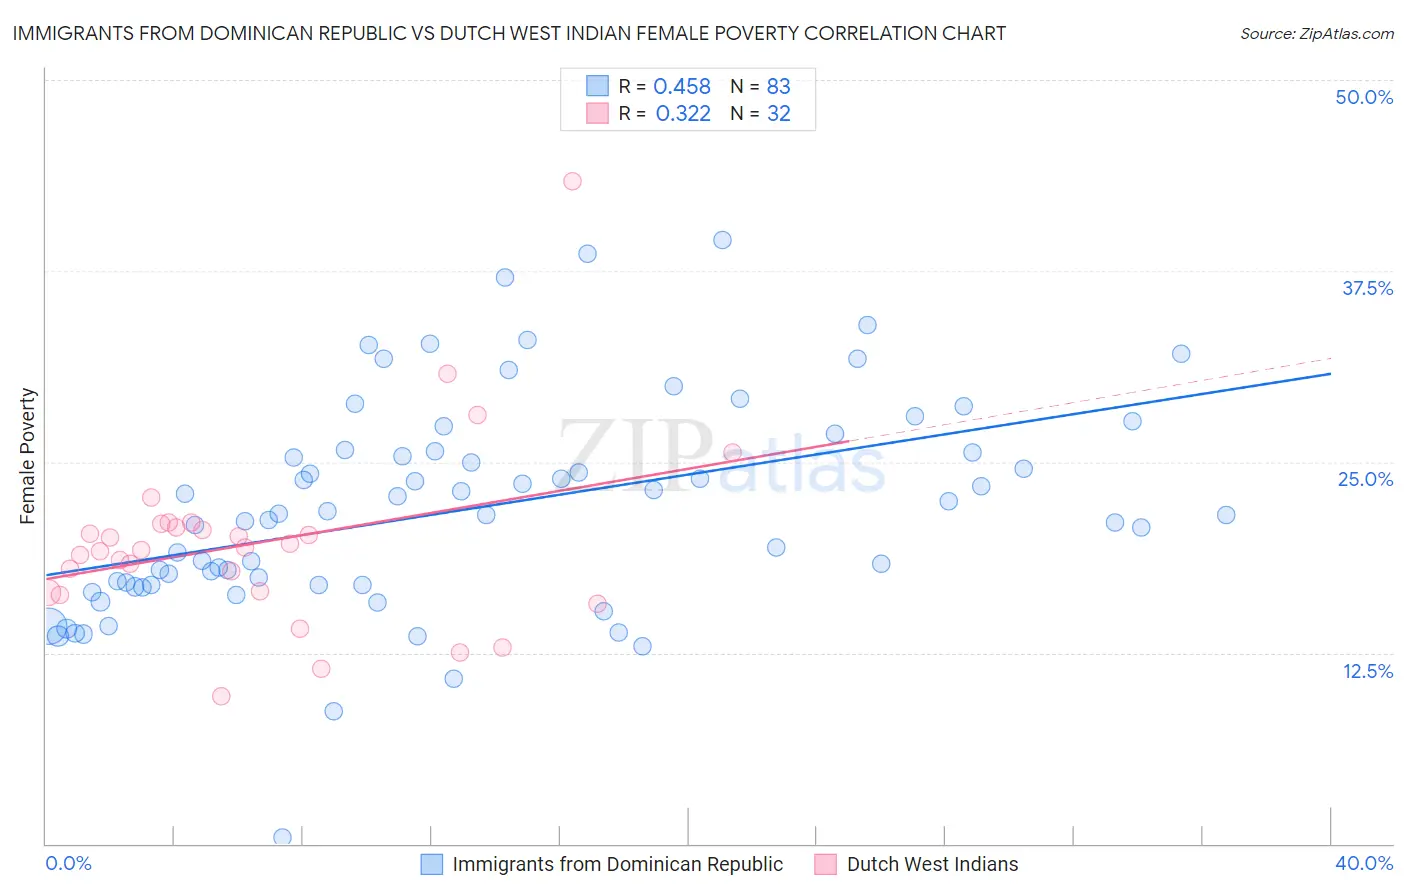
Immigrants from Dominican Republic vs Dutch West Indian Female Poverty Correlation Chart
The statistical analysis conducted on geographies consisting of 274,906,284 people shows a moderate positive correlation between the proportion of Immigrants from Dominican Republic and poverty level among females in the United States with a correlation coefficient (R) of 0.458 and weighted average of 19.3%. Similarly, the statistical analysis conducted on geographies consisting of 85,761,145 people shows a mild positive correlation between the proportion of Dutch West Indians and poverty level among females in the United States with a correlation coefficient (R) of 0.322 and weighted average of 17.1%, a difference of 13.3%.
Female Poverty Correlation Summary
| Measurement | Immigrants from Dominican Republic | Dutch West Indian |
| Minimum | 0.39% | 9.6% |
| Maximum | 39.5% | 43.3% |
| Range | 39.1% | 33.7% |
| Mean | 21.9% | 19.7% |
| Median | 21.5% | 19.3% |
| Interquartile 25% (IQ1) | 17.0% | 16.5% |
| Interquartile 75% (IQ3) | 25.7% | 20.8% |
| Interquartile Range (IQR) | 8.7% | 4.3% |
| Standard Deviation (Sample) | 7.0% | 6.1% |
| Standard Deviation (Population) | 7.0% | 6.0% |
Demographics Similar to Immigrants from Dominican Republic and Dutch West Indians by Female Poverty
In terms of female poverty, the demographic groups most similar to Immigrants from Dominican Republic are Apache (19.2%, a difference of 0.60%), Native/Alaskan (19.2%, a difference of 0.76%), Dominican (19.1%, a difference of 1.2%), Kiowa (18.6%, a difference of 3.9%), and Black/African American (18.6%, a difference of 4.1%). Similarly, the demographic groups most similar to Dutch West Indians are British West Indian (17.0%, a difference of 0.25%), U.S. Virgin Islander (17.3%, a difference of 1.4%), Honduran (17.4%, a difference of 1.7%), Immigrants from Congo (17.4%, a difference of 1.9%), and Ute (17.5%, a difference of 2.2%).
| Demographics | Rating | Rank | Female Poverty |
| British West Indians | 0.0 /100 | #313 | Tragic 17.0% |
| Dutch West Indians | 0.0 /100 | #314 | Tragic 17.1% |
| U.S. Virgin Islanders | 0.0 /100 | #315 | Tragic 17.3% |
| Hondurans | 0.0 /100 | #316 | Tragic 17.4% |
| Immigrants | Congo | 0.0 /100 | #317 | Tragic 17.4% |
| Ute | 0.0 /100 | #318 | Tragic 17.5% |
| Cajuns | 0.0 /100 | #319 | Tragic 17.5% |
| Immigrants | Dominica | 0.0 /100 | #320 | Tragic 17.5% |
| Arapaho | 0.0 /100 | #321 | Tragic 17.5% |
| Menominee | 0.0 /100 | #322 | Tragic 17.6% |
| Paiute | 0.0 /100 | #323 | Tragic 17.7% |
| Immigrants | Honduras | 0.0 /100 | #324 | Tragic 17.7% |
| Colville | 0.0 /100 | #325 | Tragic 17.8% |
| Central American Indians | 0.0 /100 | #326 | Tragic 18.0% |
| Yakama | 0.0 /100 | #327 | Tragic 18.0% |
| Blacks/African Americans | 0.0 /100 | #328 | Tragic 18.6% |
| Kiowa | 0.0 /100 | #329 | Tragic 18.6% |
| Dominicans | 0.0 /100 | #330 | Tragic 19.1% |
| Natives/Alaskans | 0.0 /100 | #331 | Tragic 19.2% |
| Apache | 0.0 /100 | #332 | Tragic 19.2% |
| Immigrants | Dominican Republic | 0.0 /100 | #333 | Tragic 19.3% |