Central American Indian vs Blackfeet 11th Grade
COMPARE
Central American Indian
Blackfeet
11th Grade
11th Grade Comparison
Central American Indians
Blackfeet
88.2%
11TH GRADE
0.0/ 100
METRIC RATING
324th/ 347
METRIC RANK
92.0%
11TH GRADE
10.1/ 100
METRIC RATING
218th/ 347
METRIC RANK
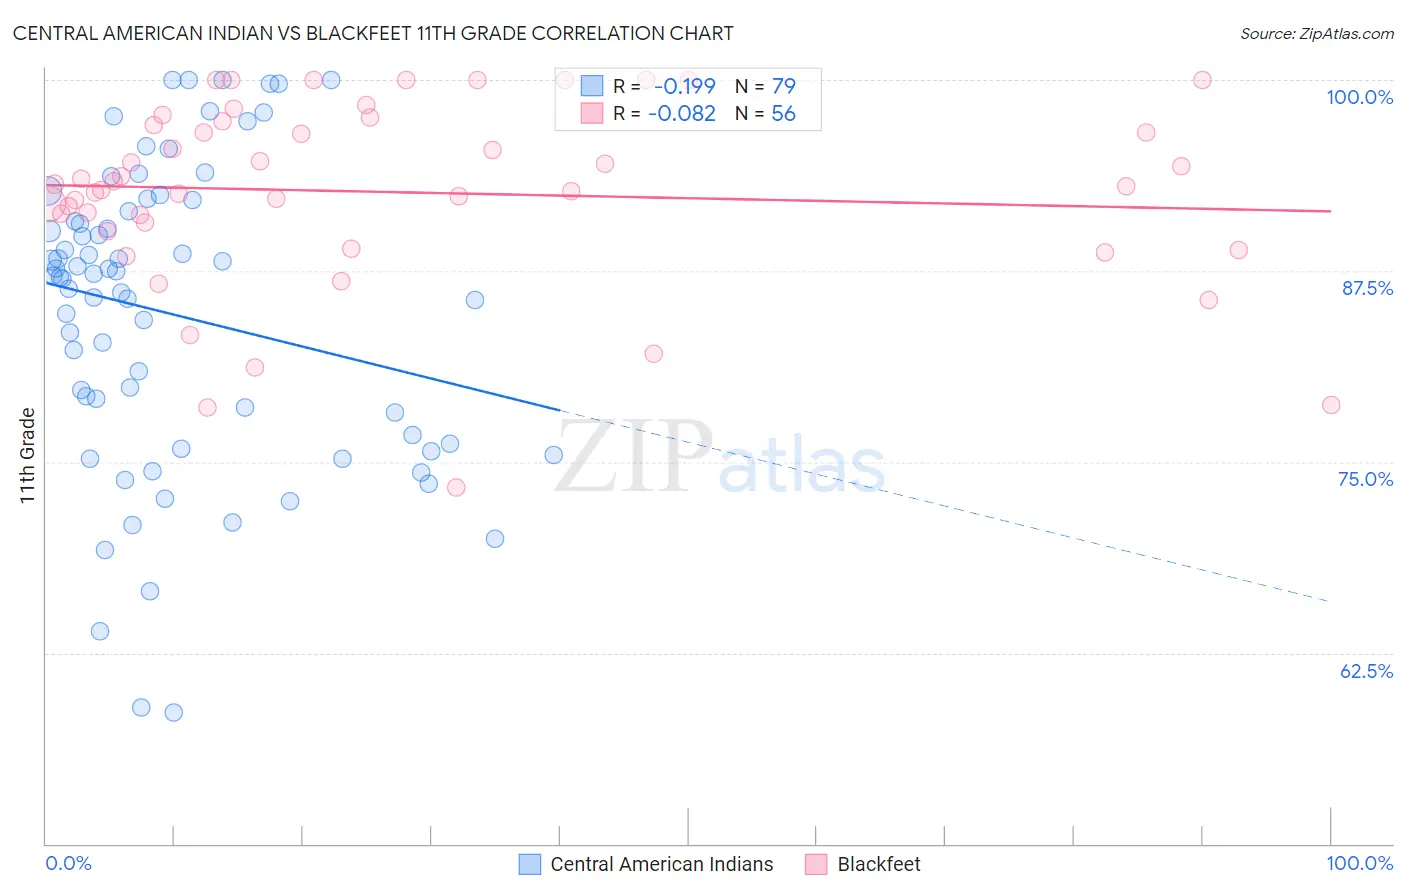
Central American Indian vs Blackfeet 11th Grade Correlation Chart
The statistical analysis conducted on geographies consisting of 326,142,643 people shows a poor negative correlation between the proportion of Central American Indians and percentage of population with at least 11th grade education in the United States with a correlation coefficient (R) of -0.199 and weighted average of 88.2%. Similarly, the statistical analysis conducted on geographies consisting of 309,582,133 people shows a slight negative correlation between the proportion of Blackfeet and percentage of population with at least 11th grade education in the United States with a correlation coefficient (R) of -0.082 and weighted average of 92.0%, a difference of 4.3%.
11th Grade Correlation Summary
| Measurement | Central American Indian | Blackfeet |
| Minimum | 58.6% | 73.3% |
| Maximum | 100.0% | 100.0% |
| Range | 41.4% | 26.7% |
| Mean | 84.6% | 92.7% |
| Median | 87.1% | 93.1% |
| Interquartile 25% (IQ1) | 76.2% | 90.4% |
| Interquartile 75% (IQ3) | 91.4% | 97.2% |
| Interquartile Range (IQR) | 15.2% | 6.8% |
| Standard Deviation (Sample) | 9.9% | 6.1% |
| Standard Deviation (Population) | 9.8% | 6.0% |
Similar Demographics by 11th Grade
Demographics Similar to Central American Indians by 11th Grade
In terms of 11th grade, the demographic groups most similar to Central American Indians are Pima (88.3%, a difference of 0.040%), Puerto Rican (88.4%, a difference of 0.12%), Immigrants from Nicaragua (88.1%, a difference of 0.13%), Immigrants from Belize (88.7%, a difference of 0.51%), and Immigrants from Armenia (88.8%, a difference of 0.60%).
| Demographics | Rating | Rank | 11th Grade |
| Lumbee | 0.0 /100 | #317 | Tragic 88.9% |
| Nicaraguans | 0.0 /100 | #318 | Tragic 88.9% |
| Belizeans | 0.0 /100 | #319 | Tragic 88.8% |
| Immigrants | Armenia | 0.0 /100 | #320 | Tragic 88.8% |
| Immigrants | Belize | 0.0 /100 | #321 | Tragic 88.7% |
| Puerto Ricans | 0.0 /100 | #322 | Tragic 88.4% |
| Pima | 0.0 /100 | #323 | Tragic 88.3% |
| Central American Indians | 0.0 /100 | #324 | Tragic 88.2% |
| Immigrants | Nicaragua | 0.0 /100 | #325 | Tragic 88.1% |
| Dominicans | 0.0 /100 | #326 | Tragic 87.7% |
| Immigrants | Cabo Verde | 0.0 /100 | #327 | Tragic 87.6% |
| Tohono O'odham | 0.0 /100 | #328 | Tragic 87.6% |
| Mexican American Indians | 0.0 /100 | #329 | Tragic 87.5% |
| Hondurans | 0.0 /100 | #330 | Tragic 87.4% |
| Hispanics or Latinos | 0.0 /100 | #331 | Tragic 87.3% |
Demographics Similar to Blackfeet by 11th Grade
In terms of 11th grade, the demographic groups most similar to Blackfeet are Portuguese (92.0%, a difference of 0.0%), Immigrants from Sierra Leone (92.0%, a difference of 0.030%), Somali (92.1%, a difference of 0.040%), Immigrants from Southern Europe (92.1%, a difference of 0.060%), and Afghan (92.1%, a difference of 0.070%).
| Demographics | Rating | Rank | 11th Grade |
| Immigrants | Micronesia | 17.7 /100 | #211 | Poor 92.2% |
| Koreans | 14.4 /100 | #212 | Poor 92.1% |
| Immigrants | Ethiopia | 13.9 /100 | #213 | Poor 92.1% |
| Afghans | 12.8 /100 | #214 | Poor 92.1% |
| Immigrants | Southern Europe | 12.5 /100 | #215 | Poor 92.1% |
| Somalis | 11.6 /100 | #216 | Poor 92.1% |
| Immigrants | Sierra Leone | 11.1 /100 | #217 | Poor 92.0% |
| Blackfeet | 10.1 /100 | #218 | Poor 92.0% |
| Portuguese | 10.0 /100 | #219 | Tragic 92.0% |
| South American Indians | 7.6 /100 | #220 | Tragic 92.0% |
| Immigrants | Liberia | 7.0 /100 | #221 | Tragic 91.9% |
| Immigrants | Africa | 6.5 /100 | #222 | Tragic 91.9% |
| Immigrants | Bahamas | 6.5 /100 | #223 | Tragic 91.9% |
| Costa Ricans | 6.3 /100 | #224 | Tragic 91.9% |
| Immigrants | Zaire | 5.4 /100 | #225 | Tragic 91.9% |