Immigrants from Moldova vs Blackfeet Single Female Poverty
COMPARE
Immigrants from Moldova
Blackfeet
Single Female Poverty
Single Female Poverty Comparison
Immigrants from Moldova
Blackfeet
18.5%
SINGLE FEMALE POVERTY
100.0/ 100
METRIC RATING
28th/ 347
METRIC RANK
25.1%
SINGLE FEMALE POVERTY
0.0/ 100
METRIC RATING
300th/ 347
METRIC RANK
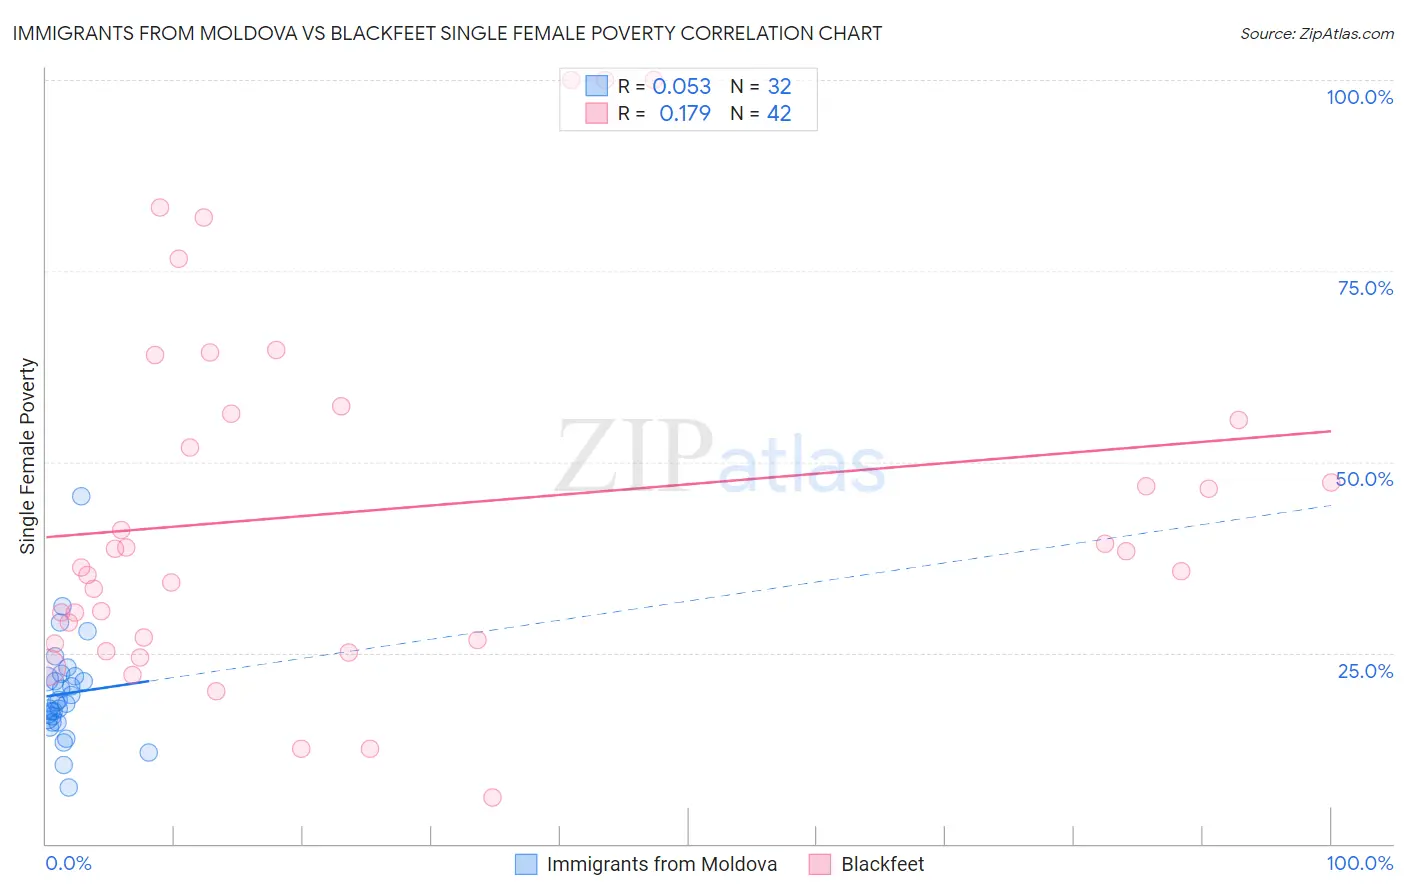
Immigrants from Moldova vs Blackfeet Single Female Poverty Correlation Chart
The statistical analysis conducted on geographies consisting of 123,598,382 people shows a slight positive correlation between the proportion of Immigrants from Moldova and poverty level among single females in the United States with a correlation coefficient (R) of 0.053 and weighted average of 18.5%. Similarly, the statistical analysis conducted on geographies consisting of 307,344,342 people shows a poor positive correlation between the proportion of Blackfeet and poverty level among single females in the United States with a correlation coefficient (R) of 0.179 and weighted average of 25.1%, a difference of 35.5%.
Single Female Poverty Correlation Summary
| Measurement | Immigrants from Moldova | Blackfeet |
| Minimum | 7.4% | 6.1% |
| Maximum | 45.5% | 100.0% |
| Range | 38.2% | 93.9% |
| Mean | 19.6% | 43.8% |
| Median | 18.4% | 37.2% |
| Interquartile 25% (IQ1) | 16.0% | 26.7% |
| Interquartile 75% (IQ3) | 21.8% | 56.2% |
| Interquartile Range (IQR) | 5.7% | 29.6% |
| Standard Deviation (Sample) | 6.9% | 23.9% |
| Standard Deviation (Population) | 6.8% | 23.6% |
Similar Demographics by Single Female Poverty
Demographics Similar to Immigrants from Moldova by Single Female Poverty
In terms of single female poverty, the demographic groups most similar to Immigrants from Moldova are Immigrants from Poland (18.5%, a difference of 0.10%), Immigrants from North Macedonia (18.5%, a difference of 0.26%), Immigrants from Asia (18.6%, a difference of 0.31%), Immigrants from Sri Lanka (18.6%, a difference of 0.39%), and Immigrants from Philippines (18.6%, a difference of 0.46%).
| Demographics | Rating | Rank | Single Female Poverty |
| Maltese | 100.0 /100 | #21 | Exceptional 18.3% |
| Burmese | 100.0 /100 | #22 | Exceptional 18.3% |
| Asians | 100.0 /100 | #23 | Exceptional 18.3% |
| Armenians | 100.0 /100 | #24 | Exceptional 18.3% |
| Immigrants | Singapore | 100.0 /100 | #25 | Exceptional 18.3% |
| Immigrants | Israel | 100.0 /100 | #26 | Exceptional 18.3% |
| Immigrants | Pakistan | 100.0 /100 | #27 | Exceptional 18.4% |
| Immigrants | Moldova | 100.0 /100 | #28 | Exceptional 18.5% |
| Immigrants | Poland | 100.0 /100 | #29 | Exceptional 18.5% |
| Immigrants | North Macedonia | 99.9 /100 | #30 | Exceptional 18.5% |
| Immigrants | Asia | 99.9 /100 | #31 | Exceptional 18.6% |
| Immigrants | Sri Lanka | 99.9 /100 | #32 | Exceptional 18.6% |
| Immigrants | Philippines | 99.9 /100 | #33 | Exceptional 18.6% |
| Koreans | 99.9 /100 | #34 | Exceptional 18.6% |
| Immigrants | Japan | 99.9 /100 | #35 | Exceptional 18.6% |
Demographics Similar to Blackfeet by Single Female Poverty
In terms of single female poverty, the demographic groups most similar to Blackfeet are Mexican (25.0%, a difference of 0.080%), Honduran (25.1%, a difference of 0.18%), Shoshone (25.1%, a difference of 0.26%), Somali (25.2%, a difference of 0.66%), and Yaqui (24.9%, a difference of 0.74%).
| Demographics | Rating | Rank | Single Female Poverty |
| Americans | 0.0 /100 | #293 | Tragic 24.5% |
| French American Indians | 0.0 /100 | #294 | Tragic 24.6% |
| Hispanics or Latinos | 0.0 /100 | #295 | Tragic 24.6% |
| Africans | 0.0 /100 | #296 | Tragic 24.8% |
| Immigrants | Central America | 0.0 /100 | #297 | Tragic 24.8% |
| Yaqui | 0.0 /100 | #298 | Tragic 24.9% |
| Mexicans | 0.0 /100 | #299 | Tragic 25.0% |
| Blackfeet | 0.0 /100 | #300 | Tragic 25.1% |
| Hondurans | 0.0 /100 | #301 | Tragic 25.1% |
| Shoshone | 0.0 /100 | #302 | Tragic 25.1% |
| Somalis | 0.0 /100 | #303 | Tragic 25.2% |
| Immigrants | Congo | 0.0 /100 | #304 | Tragic 25.3% |
| Immigrants | Dominican Republic | 0.0 /100 | #305 | Tragic 25.3% |
| Immigrants | Mexico | 0.0 /100 | #306 | Tragic 25.3% |
| Potawatomi | 0.0 /100 | #307 | Tragic 25.4% |