Guyanese vs Blackfeet Single Female Poverty
COMPARE
Guyanese
Blackfeet
Single Female Poverty
Single Female Poverty Comparison
Guyanese
Blackfeet
21.0%
SINGLE FEMALE POVERTY
52.0/ 100
METRIC RATING
172nd/ 347
METRIC RANK
25.1%
SINGLE FEMALE POVERTY
0.0/ 100
METRIC RATING
300th/ 347
METRIC RANK
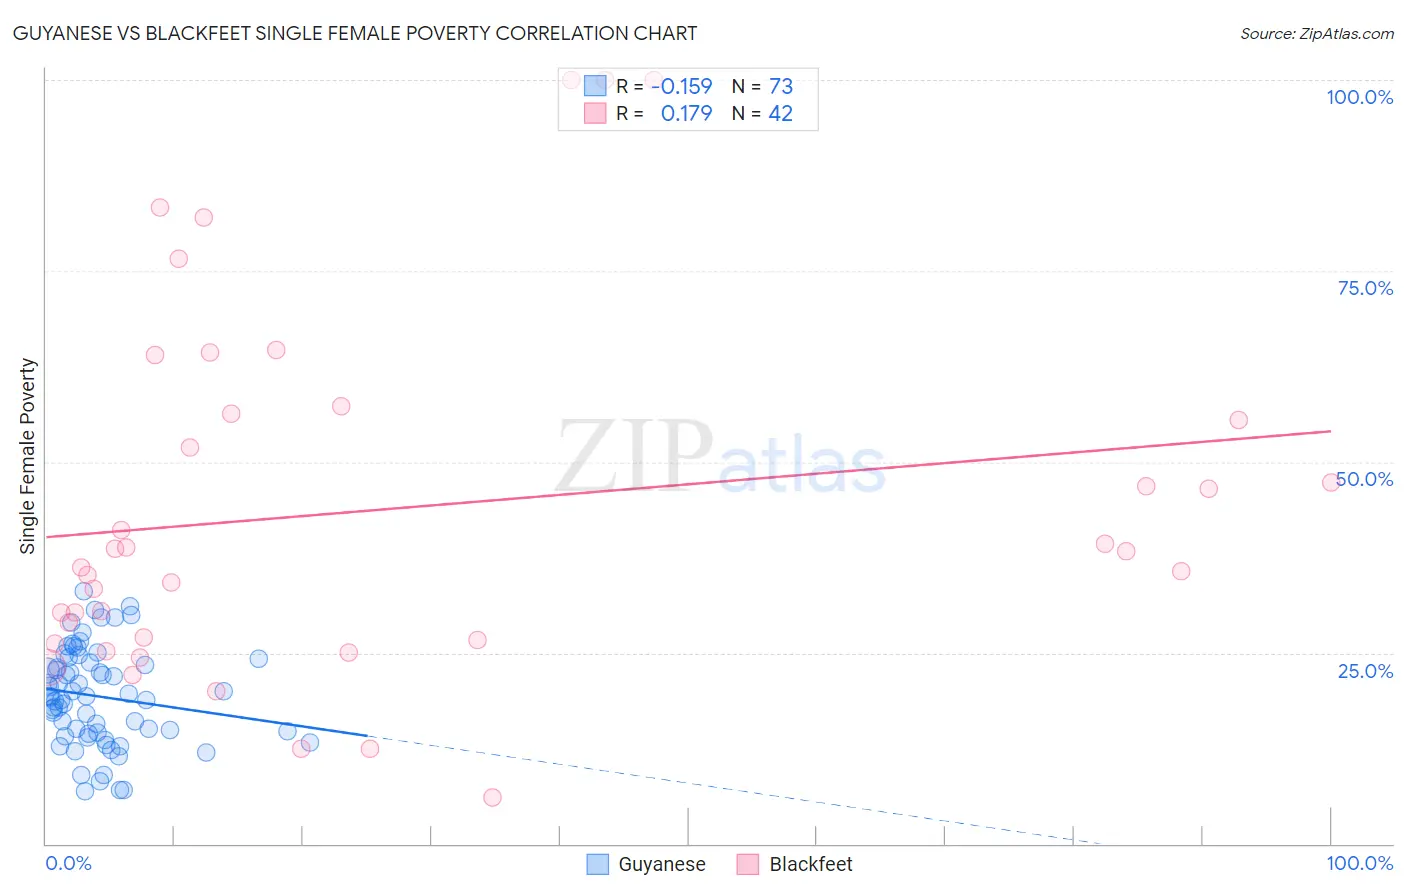
Guyanese vs Blackfeet Single Female Poverty Correlation Chart
The statistical analysis conducted on geographies consisting of 175,255,160 people shows a poor negative correlation between the proportion of Guyanese and poverty level among single females in the United States with a correlation coefficient (R) of -0.159 and weighted average of 21.0%. Similarly, the statistical analysis conducted on geographies consisting of 307,344,342 people shows a poor positive correlation between the proportion of Blackfeet and poverty level among single females in the United States with a correlation coefficient (R) of 0.179 and weighted average of 25.1%, a difference of 19.4%.
Single Female Poverty Correlation Summary
| Measurement | Guyanese | Blackfeet |
| Minimum | 6.8% | 6.1% |
| Maximum | 33.1% | 100.0% |
| Range | 26.2% | 93.9% |
| Mean | 19.3% | 43.8% |
| Median | 19.3% | 37.2% |
| Interquartile 25% (IQ1) | 14.4% | 26.7% |
| Interquartile 75% (IQ3) | 23.9% | 56.2% |
| Interquartile Range (IQR) | 9.5% | 29.6% |
| Standard Deviation (Sample) | 6.3% | 23.9% |
| Standard Deviation (Population) | 6.3% | 23.6% |
Similar Demographics by Single Female Poverty
Demographics Similar to Guyanese by Single Female Poverty
In terms of single female poverty, the demographic groups most similar to Guyanese are Moroccan (21.0%, a difference of 0.050%), New Zealander (21.0%, a difference of 0.070%), Immigrants from Guyana (21.0%, a difference of 0.090%), Cuban (21.0%, a difference of 0.13%), and Immigrants from Trinidad and Tobago (20.9%, a difference of 0.27%).
| Demographics | Rating | Rank | Single Female Poverty |
| Ugandans | 64.0 /100 | #165 | Good 20.8% |
| Norwegians | 63.0 /100 | #166 | Good 20.8% |
| Immigrants | Norway | 63.0 /100 | #167 | Good 20.8% |
| Immigrants | Costa Rica | 61.5 /100 | #168 | Good 20.9% |
| Immigrants | Trinidad and Tobago | 56.3 /100 | #169 | Average 20.9% |
| New Zealanders | 53.2 /100 | #170 | Average 21.0% |
| Moroccans | 52.8 /100 | #171 | Average 21.0% |
| Guyanese | 52.0 /100 | #172 | Average 21.0% |
| Immigrants | Guyana | 50.6 /100 | #173 | Average 21.0% |
| Cubans | 50.0 /100 | #174 | Average 21.0% |
| Czechs | 46.8 /100 | #175 | Average 21.0% |
| Canadians | 45.4 /100 | #176 | Average 21.1% |
| Scandinavians | 45.2 /100 | #177 | Average 21.1% |
| Immigrants | Bosnia and Herzegovina | 44.9 /100 | #178 | Average 21.1% |
| British | 42.9 /100 | #179 | Average 21.1% |
Demographics Similar to Blackfeet by Single Female Poverty
In terms of single female poverty, the demographic groups most similar to Blackfeet are Mexican (25.0%, a difference of 0.080%), Honduran (25.1%, a difference of 0.18%), Shoshone (25.1%, a difference of 0.26%), Somali (25.2%, a difference of 0.66%), and Yaqui (24.9%, a difference of 0.74%).
| Demographics | Rating | Rank | Single Female Poverty |
| Americans | 0.0 /100 | #293 | Tragic 24.5% |
| French American Indians | 0.0 /100 | #294 | Tragic 24.6% |
| Hispanics or Latinos | 0.0 /100 | #295 | Tragic 24.6% |
| Africans | 0.0 /100 | #296 | Tragic 24.8% |
| Immigrants | Central America | 0.0 /100 | #297 | Tragic 24.8% |
| Yaqui | 0.0 /100 | #298 | Tragic 24.9% |
| Mexicans | 0.0 /100 | #299 | Tragic 25.0% |
| Blackfeet | 0.0 /100 | #300 | Tragic 25.1% |
| Hondurans | 0.0 /100 | #301 | Tragic 25.1% |
| Shoshone | 0.0 /100 | #302 | Tragic 25.1% |
| Somalis | 0.0 /100 | #303 | Tragic 25.2% |
| Immigrants | Congo | 0.0 /100 | #304 | Tragic 25.3% |
| Immigrants | Dominican Republic | 0.0 /100 | #305 | Tragic 25.3% |
| Immigrants | Mexico | 0.0 /100 | #306 | Tragic 25.3% |
| Potawatomi | 0.0 /100 | #307 | Tragic 25.4% |