Celtic vs Immigrants from Central America Single Male Poverty
COMPARE
Celtic
Immigrants from Central America
Single Male Poverty
Single Male Poverty Comparison
Celtics
Immigrants from Central America
14.5%
SINGLE MALE POVERTY
0.0/ 100
METRIC RATING
286th/ 347
METRIC RANK
13.8%
SINGLE MALE POVERTY
0.3/ 100
METRIC RATING
257th/ 347
METRIC RANK
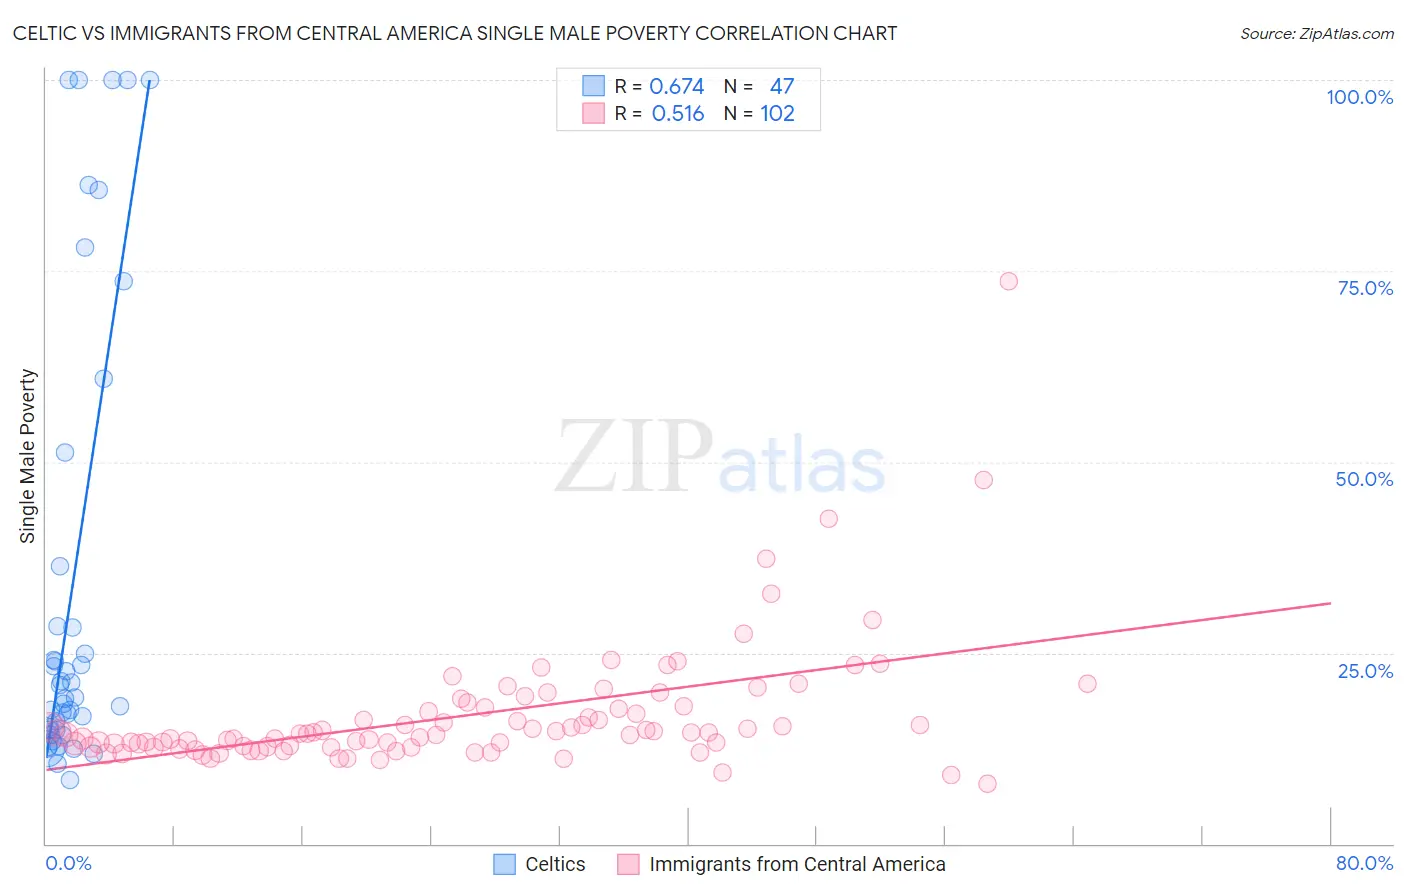
Celtic vs Immigrants from Central America Single Male Poverty Correlation Chart
The statistical analysis conducted on geographies consisting of 157,117,336 people shows a significant positive correlation between the proportion of Celtics and poverty level among single males in the United States with a correlation coefficient (R) of 0.674 and weighted average of 14.5%. Similarly, the statistical analysis conducted on geographies consisting of 454,315,872 people shows a substantial positive correlation between the proportion of Immigrants from Central America and poverty level among single males in the United States with a correlation coefficient (R) of 0.516 and weighted average of 13.8%, a difference of 5.2%.
Single Male Poverty Correlation Summary
| Measurement | Celtic | Immigrants from Central America |
| Minimum | 8.3% | 7.9% |
| Maximum | 100.0% | 73.6% |
| Range | 91.7% | 65.7% |
| Mean | 33.9% | 16.8% |
| Median | 19.2% | 14.4% |
| Interquartile 25% (IQ1) | 14.9% | 12.7% |
| Interquartile 75% (IQ3) | 36.4% | 17.9% |
| Interquartile Range (IQR) | 21.5% | 5.2% |
| Standard Deviation (Sample) | 30.2% | 8.5% |
| Standard Deviation (Population) | 29.8% | 8.5% |
Similar Demographics by Single Male Poverty
Demographics Similar to Celtics by Single Male Poverty
In terms of single male poverty, the demographic groups most similar to Celtics are Iroquois (14.5%, a difference of 0.13%), White/Caucasian (14.5%, a difference of 0.13%), Immigrants from Dominica (14.5%, a difference of 0.22%), French (14.4%, a difference of 0.32%), and U.S. Virgin Islander (14.5%, a difference of 0.44%).
| Demographics | Rating | Rank | Single Male Poverty |
| Indonesians | 0.0 /100 | #279 | Tragic 14.1% |
| Hmong | 0.0 /100 | #280 | Tragic 14.2% |
| Hispanics or Latinos | 0.0 /100 | #281 | Tragic 14.2% |
| Spanish Americans | 0.0 /100 | #282 | Tragic 14.2% |
| Yaqui | 0.0 /100 | #283 | Tragic 14.2% |
| Immigrants | Bahamas | 0.0 /100 | #284 | Tragic 14.4% |
| French | 0.0 /100 | #285 | Tragic 14.4% |
| Celtics | 0.0 /100 | #286 | Tragic 14.5% |
| Iroquois | 0.0 /100 | #287 | Tragic 14.5% |
| Whites/Caucasians | 0.0 /100 | #288 | Tragic 14.5% |
| Immigrants | Dominica | 0.0 /100 | #289 | Tragic 14.5% |
| U.S. Virgin Islanders | 0.0 /100 | #290 | Tragic 14.5% |
| Bahamians | 0.0 /100 | #291 | Tragic 14.6% |
| Immigrants | Nonimmigrants | 0.0 /100 | #292 | Tragic 14.6% |
| French Canadians | 0.0 /100 | #293 | Tragic 14.6% |
Demographics Similar to Immigrants from Central America by Single Male Poverty
In terms of single male poverty, the demographic groups most similar to Immigrants from Central America are Immigrants from Guatemala (13.8%, a difference of 0.070%), Guatemalan (13.8%, a difference of 0.11%), Immigrants from Belize (13.7%, a difference of 0.18%), Swiss (13.8%, a difference of 0.18%), and Hungarian (13.8%, a difference of 0.23%).
| Demographics | Rating | Rank | Single Male Poverty |
| Immigrants | Somalia | 1.0 /100 | #250 | Tragic 13.6% |
| Immigrants | Zaire | 0.9 /100 | #251 | Tragic 13.6% |
| Finns | 0.9 /100 | #252 | Tragic 13.6% |
| German Russians | 0.8 /100 | #253 | Tragic 13.6% |
| Sub-Saharan Africans | 0.5 /100 | #254 | Tragic 13.7% |
| Spaniards | 0.4 /100 | #255 | Tragic 13.7% |
| Immigrants | Belize | 0.4 /100 | #256 | Tragic 13.7% |
| Immigrants | Central America | 0.3 /100 | #257 | Tragic 13.8% |
| Immigrants | Guatemala | 0.3 /100 | #258 | Tragic 13.8% |
| Guatemalans | 0.3 /100 | #259 | Tragic 13.8% |
| Swiss | 0.3 /100 | #260 | Tragic 13.8% |
| Hungarians | 0.3 /100 | #261 | Tragic 13.8% |
| Fijians | 0.3 /100 | #262 | Tragic 13.8% |
| Cape Verdeans | 0.2 /100 | #263 | Tragic 13.8% |
| West Indians | 0.2 /100 | #264 | Tragic 13.8% |