Celtic vs Immigrants from Morocco Single Male Poverty
COMPARE
Celtic
Immigrants from Morocco
Single Male Poverty
Single Male Poverty Comparison
Celtics
Immigrants from Morocco
14.5%
SINGLE MALE POVERTY
0.0/ 100
METRIC RATING
286th/ 347
METRIC RANK
12.3%
SINGLE MALE POVERTY
95.6/ 100
METRIC RATING
106th/ 347
METRIC RANK
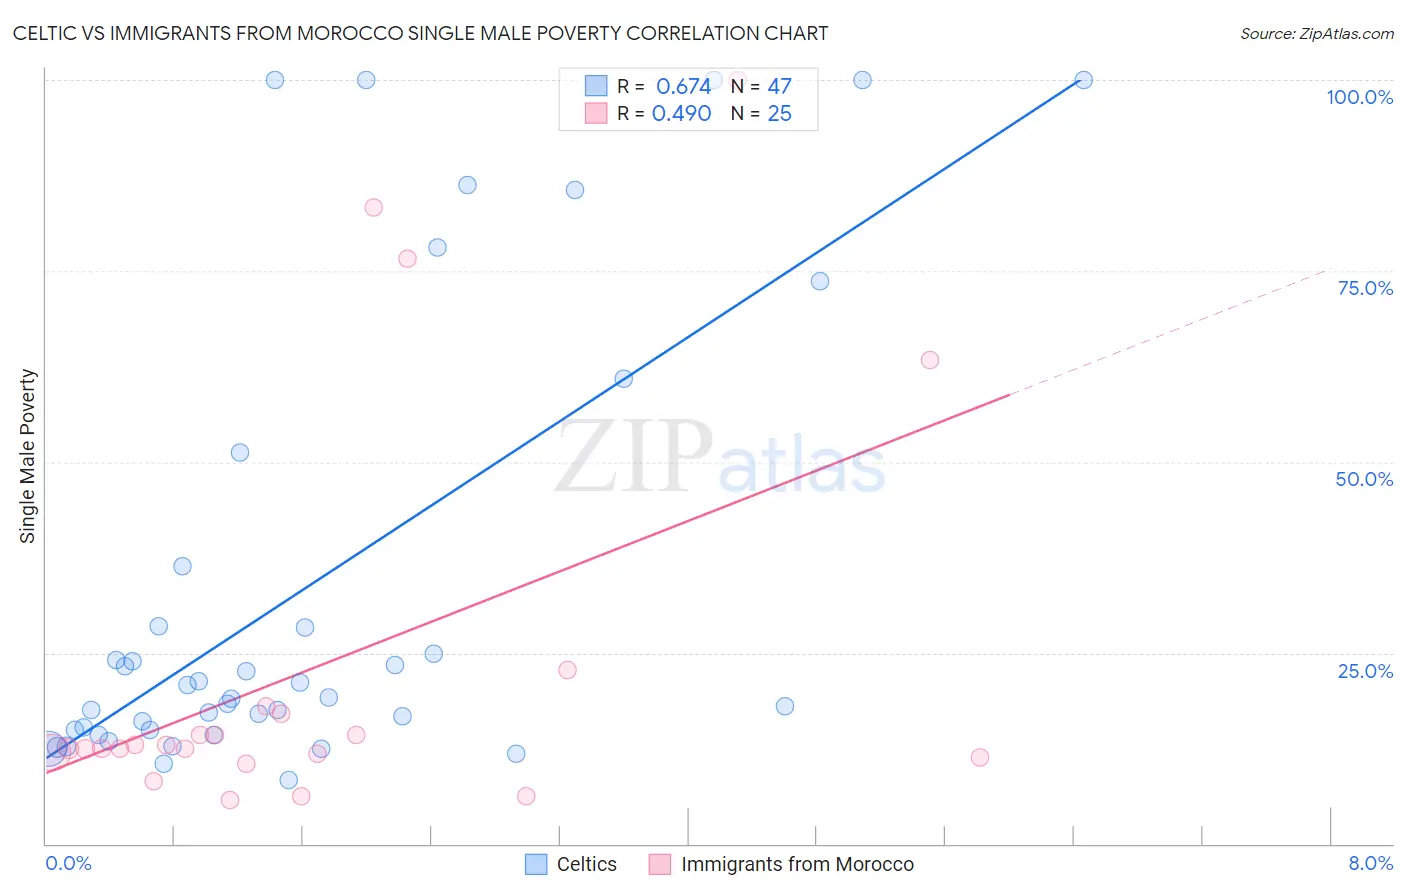
Celtic vs Immigrants from Morocco Single Male Poverty Correlation Chart
The statistical analysis conducted on geographies consisting of 157,117,336 people shows a significant positive correlation between the proportion of Celtics and poverty level among single males in the United States with a correlation coefficient (R) of 0.674 and weighted average of 14.5%. Similarly, the statistical analysis conducted on geographies consisting of 166,868,254 people shows a moderate positive correlation between the proportion of Immigrants from Morocco and poverty level among single males in the United States with a correlation coefficient (R) of 0.490 and weighted average of 12.3%, a difference of 17.8%.
Single Male Poverty Correlation Summary
| Measurement | Celtic | Immigrants from Morocco |
| Minimum | 8.3% | 5.8% |
| Maximum | 100.0% | 100.0% |
| Range | 91.7% | 94.2% |
| Mean | 33.9% | 23.3% |
| Median | 19.2% | 12.5% |
| Interquartile 25% (IQ1) | 14.9% | 11.5% |
| Interquartile 75% (IQ3) | 36.4% | 17.5% |
| Interquartile Range (IQR) | 21.5% | 5.9% |
| Standard Deviation (Sample) | 30.2% | 26.4% |
| Standard Deviation (Population) | 29.8% | 25.9% |
Similar Demographics by Single Male Poverty
Demographics Similar to Celtics by Single Male Poverty
In terms of single male poverty, the demographic groups most similar to Celtics are Iroquois (14.5%, a difference of 0.13%), White/Caucasian (14.5%, a difference of 0.13%), Immigrants from Dominica (14.5%, a difference of 0.22%), French (14.4%, a difference of 0.32%), and U.S. Virgin Islander (14.5%, a difference of 0.44%).
| Demographics | Rating | Rank | Single Male Poverty |
| Indonesians | 0.0 /100 | #279 | Tragic 14.1% |
| Hmong | 0.0 /100 | #280 | Tragic 14.2% |
| Hispanics or Latinos | 0.0 /100 | #281 | Tragic 14.2% |
| Spanish Americans | 0.0 /100 | #282 | Tragic 14.2% |
| Yaqui | 0.0 /100 | #283 | Tragic 14.2% |
| Immigrants | Bahamas | 0.0 /100 | #284 | Tragic 14.4% |
| French | 0.0 /100 | #285 | Tragic 14.4% |
| Celtics | 0.0 /100 | #286 | Tragic 14.5% |
| Iroquois | 0.0 /100 | #287 | Tragic 14.5% |
| Whites/Caucasians | 0.0 /100 | #288 | Tragic 14.5% |
| Immigrants | Dominica | 0.0 /100 | #289 | Tragic 14.5% |
| U.S. Virgin Islanders | 0.0 /100 | #290 | Tragic 14.5% |
| Bahamians | 0.0 /100 | #291 | Tragic 14.6% |
| Immigrants | Nonimmigrants | 0.0 /100 | #292 | Tragic 14.6% |
| French Canadians | 0.0 /100 | #293 | Tragic 14.6% |
Demographics Similar to Immigrants from Morocco by Single Male Poverty
In terms of single male poverty, the demographic groups most similar to Immigrants from Morocco are Jordanian (12.3%, a difference of 0.080%), Iraqi (12.3%, a difference of 0.18%), Immigrants from Eastern Africa (12.3%, a difference of 0.20%), Ugandan (12.3%, a difference of 0.33%), and Immigrants from Armenia (12.2%, a difference of 0.40%).
| Demographics | Rating | Rank | Single Male Poverty |
| Immigrants | Cuba | 97.3 /100 | #99 | Exceptional 12.2% |
| Immigrants | Australia | 97.1 /100 | #100 | Exceptional 12.2% |
| Immigrants | Latvia | 97.0 /100 | #101 | Exceptional 12.2% |
| Immigrants | Europe | 97.0 /100 | #102 | Exceptional 12.2% |
| Immigrants | Armenia | 96.7 /100 | #103 | Exceptional 12.2% |
| Immigrants | Kazakhstan | 96.7 /100 | #104 | Exceptional 12.2% |
| Jordanians | 95.9 /100 | #105 | Exceptional 12.3% |
| Immigrants | Morocco | 95.6 /100 | #106 | Exceptional 12.3% |
| Iraqis | 95.1 /100 | #107 | Exceptional 12.3% |
| Immigrants | Eastern Africa | 95.0 /100 | #108 | Exceptional 12.3% |
| Ugandans | 94.5 /100 | #109 | Exceptional 12.3% |
| Immigrants | Portugal | 93.6 /100 | #110 | Exceptional 12.3% |
| Immigrants | North Macedonia | 93.6 /100 | #111 | Exceptional 12.3% |
| Kenyans | 93.3 /100 | #112 | Exceptional 12.4% |
| Pakistanis | 92.4 /100 | #113 | Exceptional 12.4% |