Celtic vs Immigrants from Central America 6th Grade
COMPARE
Celtic
Immigrants from Central America
6th Grade
6th Grade Comparison
Celtics
Immigrants from Central America
97.8%
6TH GRADE
99.9/ 100
METRIC RATING
48th/ 347
METRIC RANK
94.0%
6TH GRADE
0.0/ 100
METRIC RATING
342nd/ 347
METRIC RANK
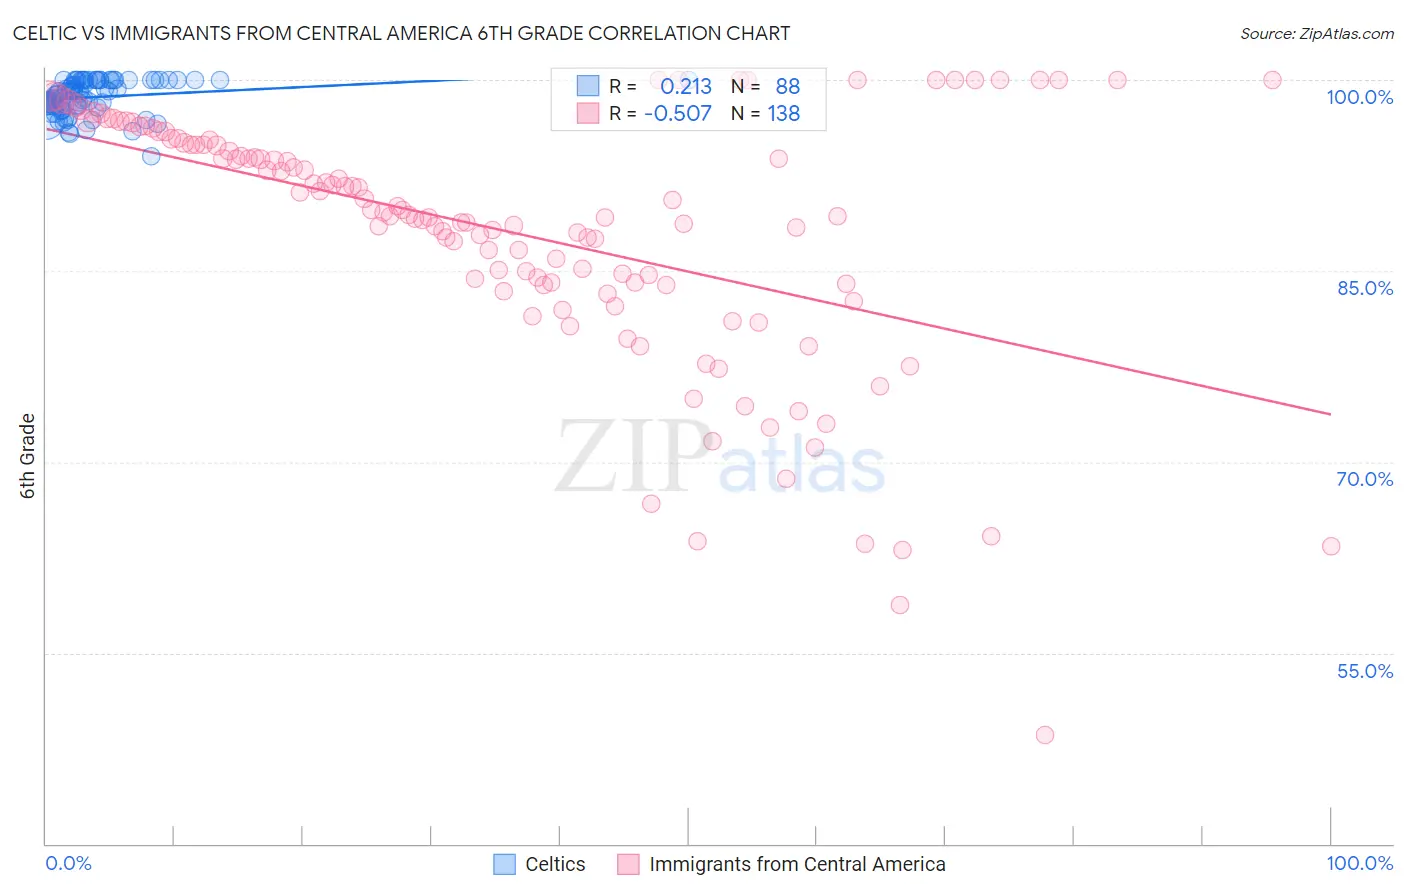
Celtic vs Immigrants from Central America 6th Grade Correlation Chart
The statistical analysis conducted on geographies consisting of 168,875,705 people shows a weak positive correlation between the proportion of Celtics and percentage of population with at least 6th grade education in the United States with a correlation coefficient (R) of 0.213 and weighted average of 97.8%. Similarly, the statistical analysis conducted on geographies consisting of 536,554,550 people shows a substantial negative correlation between the proportion of Immigrants from Central America and percentage of population with at least 6th grade education in the United States with a correlation coefficient (R) of -0.507 and weighted average of 94.0%, a difference of 4.0%.
6th Grade Correlation Summary
| Measurement | Celtic | Immigrants from Central America |
| Minimum | 94.0% | 48.6% |
| Maximum | 100.0% | 100.0% |
| Range | 6.0% | 51.4% |
| Mean | 98.6% | 88.1% |
| Median | 98.9% | 89.5% |
| Interquartile 25% (IQ1) | 98.0% | 84.0% |
| Interquartile 75% (IQ3) | 100.0% | 95.3% |
| Interquartile Range (IQR) | 2.0% | 11.4% |
| Standard Deviation (Sample) | 1.3% | 9.9% |
| Standard Deviation (Population) | 1.3% | 9.9% |
Similar Demographics by 6th Grade
Demographics Similar to Celtics by 6th Grade
In terms of 6th grade, the demographic groups most similar to Celtics are Native Hawaiian (97.8%, a difference of 0.0%), Estonian (97.8%, a difference of 0.0%), Immigrants from Scotland (97.8%, a difference of 0.0%), Arapaho (97.8%, a difference of 0.010%), and Maltese (97.8%, a difference of 0.010%).
| Demographics | Rating | Rank | 6th Grade |
| Eastern Europeans | 99.9 /100 | #41 | Exceptional 97.9% |
| Hungarians | 99.9 /100 | #42 | Exceptional 97.8% |
| Northern Europeans | 99.9 /100 | #43 | Exceptional 97.8% |
| Czechoslovakians | 99.9 /100 | #44 | Exceptional 97.8% |
| Bulgarians | 99.9 /100 | #45 | Exceptional 97.8% |
| Arapaho | 99.9 /100 | #46 | Exceptional 97.8% |
| Native Hawaiians | 99.9 /100 | #47 | Exceptional 97.8% |
| Celtics | 99.9 /100 | #48 | Exceptional 97.8% |
| Estonians | 99.8 /100 | #49 | Exceptional 97.8% |
| Immigrants | Scotland | 99.8 /100 | #50 | Exceptional 97.8% |
| Maltese | 99.8 /100 | #51 | Exceptional 97.8% |
| Australians | 99.8 /100 | #52 | Exceptional 97.8% |
| Slavs | 99.8 /100 | #53 | Exceptional 97.8% |
| Creek | 99.8 /100 | #54 | Exceptional 97.7% |
| Aleuts | 99.8 /100 | #55 | Exceptional 97.7% |
Demographics Similar to Immigrants from Central America by 6th Grade
In terms of 6th grade, the demographic groups most similar to Immigrants from Central America are Immigrants from Mexico (93.9%, a difference of 0.060%), Immigrants from Guatemala (93.9%, a difference of 0.060%), Salvadoran (93.9%, a difference of 0.070%), Immigrants from Yemen (94.1%, a difference of 0.10%), and Guatemalan (94.2%, a difference of 0.22%).
| Demographics | Rating | Rank | 6th Grade |
| Immigrants | Latin America | 0.0 /100 | #333 | Tragic 94.7% |
| Immigrants | Azores | 0.0 /100 | #334 | Tragic 94.7% |
| Mexicans | 0.0 /100 | #335 | Tragic 94.6% |
| Immigrants | Dominican Republic | 0.0 /100 | #336 | Tragic 94.6% |
| Central Americans | 0.0 /100 | #337 | Tragic 94.5% |
| Immigrants | Cabo Verde | 0.0 /100 | #338 | Tragic 94.4% |
| Yakama | 0.0 /100 | #339 | Tragic 94.3% |
| Guatemalans | 0.0 /100 | #340 | Tragic 94.2% |
| Immigrants | Yemen | 0.0 /100 | #341 | Tragic 94.1% |
| Immigrants | Central America | 0.0 /100 | #342 | Tragic 94.0% |
| Immigrants | Mexico | 0.0 /100 | #343 | Tragic 93.9% |
| Immigrants | Guatemala | 0.0 /100 | #344 | Tragic 93.9% |
| Salvadorans | 0.0 /100 | #345 | Tragic 93.9% |
| Spanish American Indians | 0.0 /100 | #346 | Tragic 93.6% |
| Immigrants | El Salvador | 0.0 /100 | #347 | Tragic 93.6% |