Celtic vs Immigrants from Central America Child Poverty Under the Age of 16
COMPARE
Celtic
Immigrants from Central America
Child Poverty Under the Age of 16
Child Poverty Under the Age of 16 Comparison
Celtics
Immigrants from Central America
16.4%
CHILD POVERTY UNDER THE AGE OF 16
38.2/ 100
METRIC RATING
183rd/ 347
METRIC RANK
21.3%
CHILD POVERTY UNDER THE AGE OF 16
0.0/ 100
METRIC RATING
307th/ 347
METRIC RANK
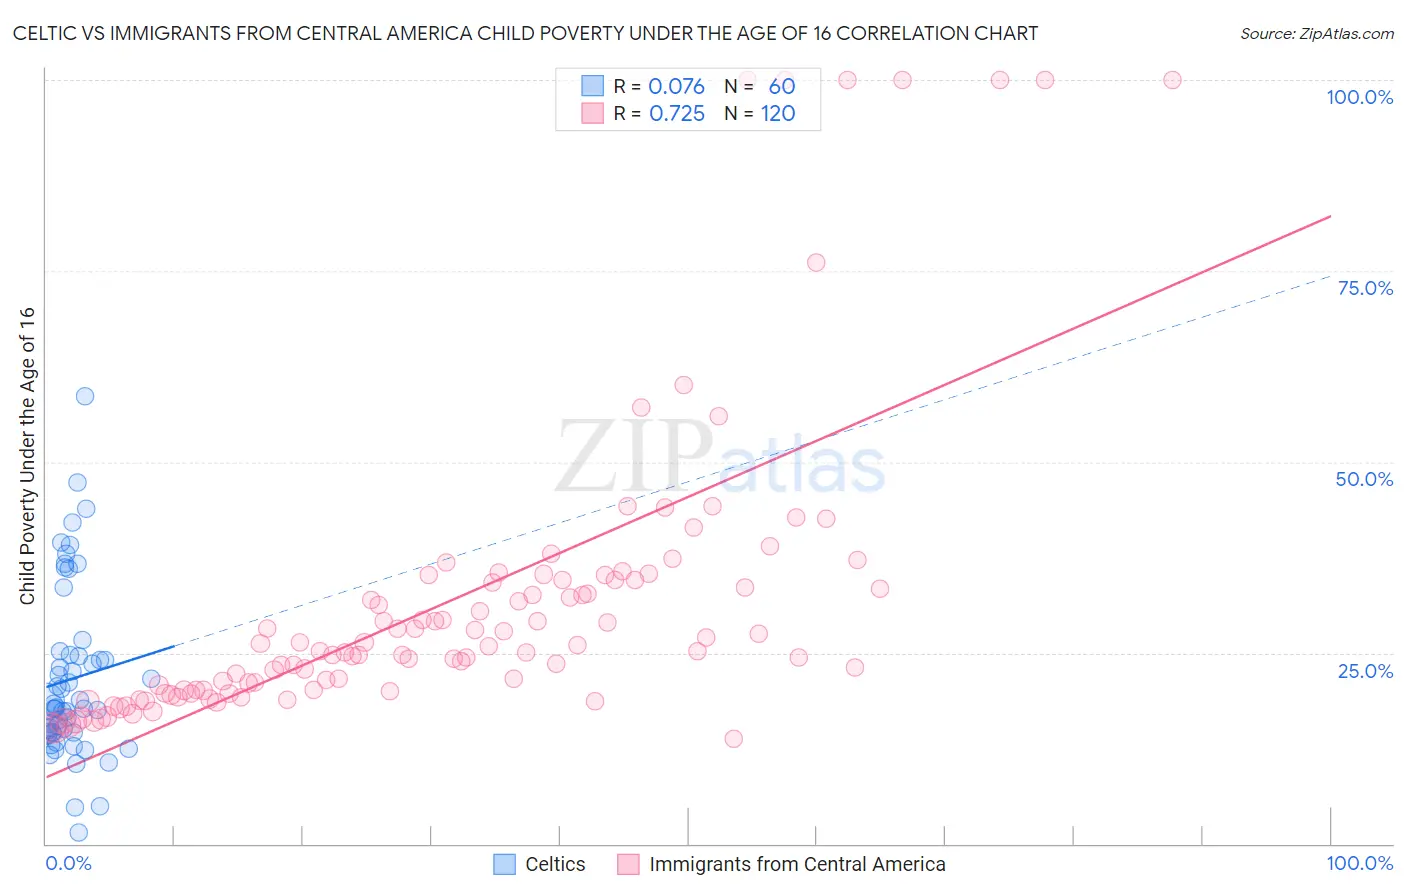
Celtic vs Immigrants from Central America Child Poverty Under the Age of 16 Correlation Chart
The statistical analysis conducted on geographies consisting of 168,036,388 people shows a slight positive correlation between the proportion of Celtics and poverty level among children under the age of 16 in the United States with a correlation coefficient (R) of 0.076 and weighted average of 16.4%. Similarly, the statistical analysis conducted on geographies consisting of 528,817,501 people shows a strong positive correlation between the proportion of Immigrants from Central America and poverty level among children under the age of 16 in the United States with a correlation coefficient (R) of 0.725 and weighted average of 21.3%, a difference of 29.3%.
Child Poverty Under the Age of 16 Correlation Summary
| Measurement | Celtic | Immigrants from Central America |
| Minimum | 1.4% | 13.8% |
| Maximum | 58.6% | 100.0% |
| Range | 57.2% | 86.2% |
| Mean | 21.5% | 31.6% |
| Median | 17.8% | 25.5% |
| Interquartile 25% (IQ1) | 14.5% | 20.1% |
| Interquartile 75% (IQ3) | 24.6% | 34.5% |
| Interquartile Range (IQR) | 10.1% | 14.4% |
| Standard Deviation (Sample) | 11.2% | 19.7% |
| Standard Deviation (Population) | 11.1% | 19.6% |
Similar Demographics by Child Poverty Under the Age of 16
Demographics Similar to Celtics by Child Poverty Under the Age of 16
In terms of child poverty under the age of 16, the demographic groups most similar to Celtics are Hawaiian (16.4%, a difference of 0.010%), Immigrants from Western Asia (16.4%, a difference of 0.020%), Immigrants from Bosnia and Herzegovina (16.5%, a difference of 0.10%), Immigrants from South America (16.4%, a difference of 0.33%), and South American Indian (16.4%, a difference of 0.46%).
| Demographics | Rating | Rank | Child Poverty Under the Age of 16 |
| Lebanese | 45.9 /100 | #176 | Average 16.3% |
| Ethiopians | 43.4 /100 | #177 | Average 16.3% |
| Immigrants | Ethiopia | 42.3 /100 | #178 | Average 16.4% |
| Immigrants | Syria | 42.3 /100 | #179 | Average 16.4% |
| South American Indians | 41.8 /100 | #180 | Average 16.4% |
| Immigrants | South America | 40.8 /100 | #181 | Average 16.4% |
| Hawaiians | 38.2 /100 | #182 | Fair 16.4% |
| Celtics | 38.2 /100 | #183 | Fair 16.4% |
| Immigrants | Western Asia | 38.0 /100 | #184 | Fair 16.4% |
| Immigrants | Bosnia and Herzegovina | 37.4 /100 | #185 | Fair 16.5% |
| Kenyans | 34.1 /100 | #186 | Fair 16.5% |
| Arabs | 31.4 /100 | #187 | Fair 16.6% |
| Immigrants | Morocco | 31.2 /100 | #188 | Fair 16.6% |
| Immigrants | Portugal | 30.0 /100 | #189 | Fair 16.6% |
| Immigrants | Costa Rica | 29.6 /100 | #190 | Fair 16.6% |
Demographics Similar to Immigrants from Central America by Child Poverty Under the Age of 16
In terms of child poverty under the age of 16, the demographic groups most similar to Immigrants from Central America are British West Indian (21.3%, a difference of 0.29%), Guatemalan (21.2%, a difference of 0.41%), Seminole (21.1%, a difference of 0.57%), Immigrants from Mexico (21.5%, a difference of 0.94%), and Bahamian (21.5%, a difference of 0.96%).
| Demographics | Rating | Rank | Child Poverty Under the Age of 16 |
| Indonesians | 0.0 /100 | #300 | Tragic 21.0% |
| Immigrants | Grenada | 0.0 /100 | #301 | Tragic 21.0% |
| Immigrants | Bahamas | 0.0 /100 | #302 | Tragic 21.0% |
| Choctaw | 0.0 /100 | #303 | Tragic 21.0% |
| Somalis | 0.0 /100 | #304 | Tragic 21.0% |
| Seminole | 0.0 /100 | #305 | Tragic 21.1% |
| Guatemalans | 0.0 /100 | #306 | Tragic 21.2% |
| Immigrants | Central America | 0.0 /100 | #307 | Tragic 21.3% |
| British West Indians | 0.0 /100 | #308 | Tragic 21.3% |
| Immigrants | Mexico | 0.0 /100 | #309 | Tragic 21.5% |
| Bahamians | 0.0 /100 | #310 | Tragic 21.5% |
| Dutch West Indians | 0.0 /100 | #311 | Tragic 21.5% |
| Ute | 0.0 /100 | #312 | Tragic 21.5% |
| Creek | 0.0 /100 | #313 | Tragic 21.5% |
| Immigrants | Somalia | 0.0 /100 | #314 | Tragic 21.6% |