Celtic vs Yugoslavian Single Male Poverty
COMPARE
Celtic
Yugoslavian
Single Male Poverty
Single Male Poverty Comparison
Celtics
Yugoslavians
14.5%
SINGLE MALE POVERTY
0.0/ 100
METRIC RATING
286th/ 347
METRIC RANK
12.6%
SINGLE MALE POVERTY
73.9/ 100
METRIC RATING
148th/ 347
METRIC RANK
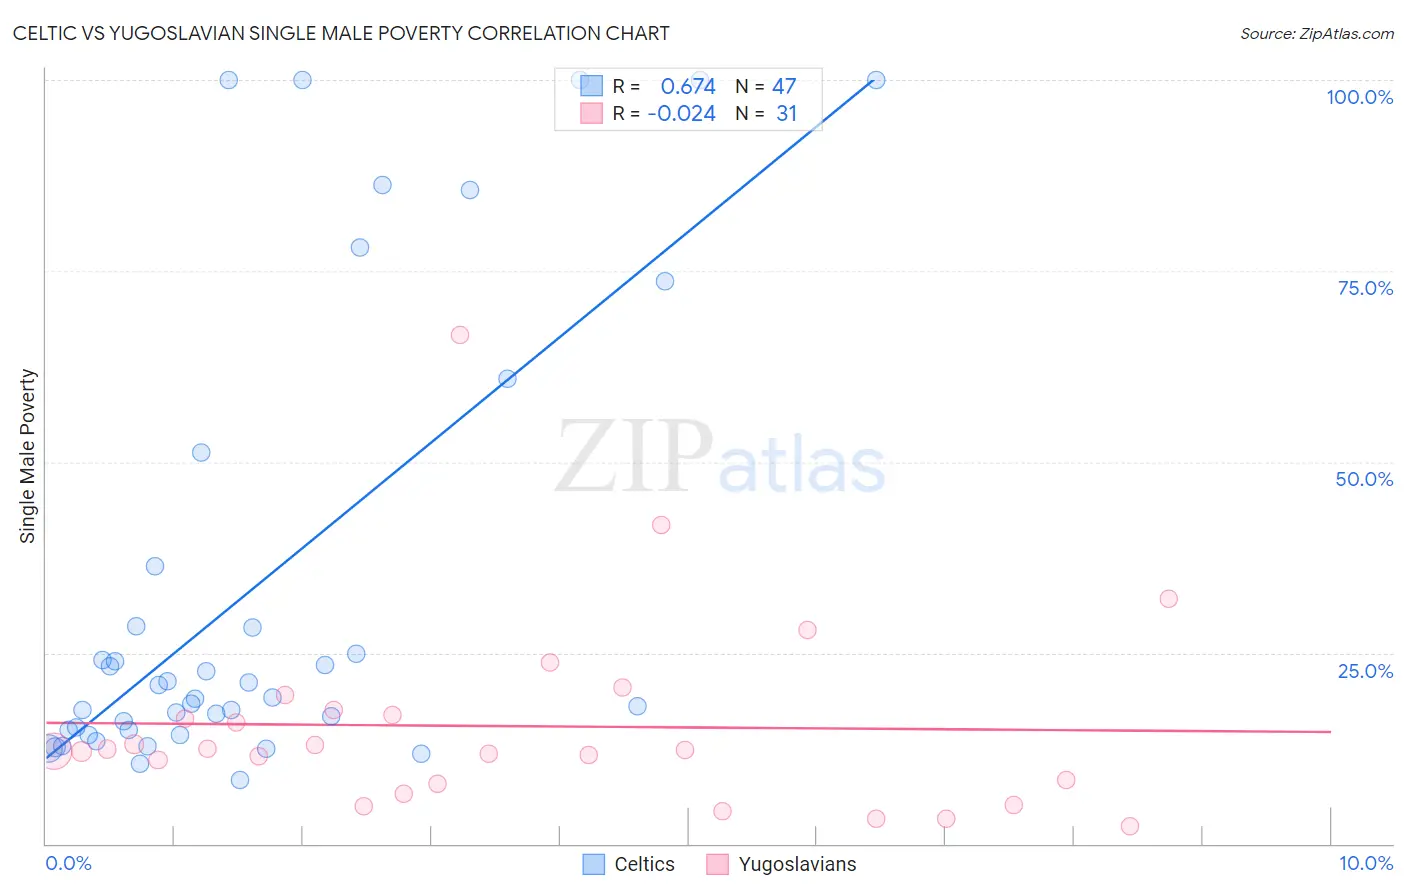
Celtic vs Yugoslavian Single Male Poverty Correlation Chart
The statistical analysis conducted on geographies consisting of 157,117,336 people shows a significant positive correlation between the proportion of Celtics and poverty level among single males in the United States with a correlation coefficient (R) of 0.674 and weighted average of 14.5%. Similarly, the statistical analysis conducted on geographies consisting of 258,600,754 people shows no correlation between the proportion of Yugoslavians and poverty level among single males in the United States with a correlation coefficient (R) of -0.024 and weighted average of 12.6%, a difference of 14.6%.
Single Male Poverty Correlation Summary
| Measurement | Celtic | Yugoslavian |
| Minimum | 8.3% | 2.3% |
| Maximum | 100.0% | 66.7% |
| Range | 91.7% | 64.4% |
| Mean | 33.9% | 15.4% |
| Median | 19.2% | 12.3% |
| Interquartile 25% (IQ1) | 14.9% | 7.9% |
| Interquartile 75% (IQ3) | 36.4% | 17.6% |
| Interquartile Range (IQR) | 21.5% | 9.7% |
| Standard Deviation (Sample) | 30.2% | 12.9% |
| Standard Deviation (Population) | 29.8% | 12.7% |
Similar Demographics by Single Male Poverty
Demographics Similar to Celtics by Single Male Poverty
In terms of single male poverty, the demographic groups most similar to Celtics are Iroquois (14.5%, a difference of 0.13%), White/Caucasian (14.5%, a difference of 0.13%), Immigrants from Dominica (14.5%, a difference of 0.22%), French (14.4%, a difference of 0.32%), and U.S. Virgin Islander (14.5%, a difference of 0.44%).
| Demographics | Rating | Rank | Single Male Poverty |
| Indonesians | 0.0 /100 | #279 | Tragic 14.1% |
| Hmong | 0.0 /100 | #280 | Tragic 14.2% |
| Hispanics or Latinos | 0.0 /100 | #281 | Tragic 14.2% |
| Spanish Americans | 0.0 /100 | #282 | Tragic 14.2% |
| Yaqui | 0.0 /100 | #283 | Tragic 14.2% |
| Immigrants | Bahamas | 0.0 /100 | #284 | Tragic 14.4% |
| French | 0.0 /100 | #285 | Tragic 14.4% |
| Celtics | 0.0 /100 | #286 | Tragic 14.5% |
| Iroquois | 0.0 /100 | #287 | Tragic 14.5% |
| Whites/Caucasians | 0.0 /100 | #288 | Tragic 14.5% |
| Immigrants | Dominica | 0.0 /100 | #289 | Tragic 14.5% |
| U.S. Virgin Islanders | 0.0 /100 | #290 | Tragic 14.5% |
| Bahamians | 0.0 /100 | #291 | Tragic 14.6% |
| Immigrants | Nonimmigrants | 0.0 /100 | #292 | Tragic 14.6% |
| French Canadians | 0.0 /100 | #293 | Tragic 14.6% |
Demographics Similar to Yugoslavians by Single Male Poverty
In terms of single male poverty, the demographic groups most similar to Yugoslavians are Malaysian (12.6%, a difference of 0.060%), Immigrants from Lebanon (12.6%, a difference of 0.070%), Native Hawaiian (12.6%, a difference of 0.070%), Sierra Leonean (12.6%, a difference of 0.070%), and Hawaiian (12.6%, a difference of 0.080%).
| Demographics | Rating | Rank | Single Male Poverty |
| Okinawans | 75.9 /100 | #141 | Good 12.6% |
| Immigrants | Uganda | 75.9 /100 | #142 | Good 12.6% |
| Immigrants | France | 75.8 /100 | #143 | Good 12.6% |
| Hawaiians | 75.1 /100 | #144 | Good 12.6% |
| Immigrants | Lebanon | 75.0 /100 | #145 | Good 12.6% |
| Native Hawaiians | 75.0 /100 | #146 | Good 12.6% |
| Malaysians | 74.8 /100 | #147 | Good 12.6% |
| Yugoslavians | 73.9 /100 | #148 | Good 12.6% |
| Sierra Leoneans | 73.0 /100 | #149 | Good 12.6% |
| Immigrants | Panama | 72.1 /100 | #150 | Good 12.6% |
| Immigrants | Hungary | 71.9 /100 | #151 | Good 12.6% |
| Australians | 71.4 /100 | #152 | Good 12.6% |
| Immigrants | Immigrants | 70.1 /100 | #153 | Good 12.7% |
| Immigrants | Scotland | 68.9 /100 | #154 | Good 12.7% |
| Immigrants | Spain | 68.7 /100 | #155 | Good 12.7% |