Celtic vs Immigrants from Central America Median Family Income
COMPARE
Celtic
Immigrants from Central America
Median Family Income
Median Family Income Comparison
Celtics
Immigrants from Central America
$101,139
MEDIAN FAMILY INCOME
31.3/ 100
METRIC RATING
186th/ 347
METRIC RANK
$85,050
MEDIAN FAMILY INCOME
0.0/ 100
METRIC RATING
310th/ 347
METRIC RANK
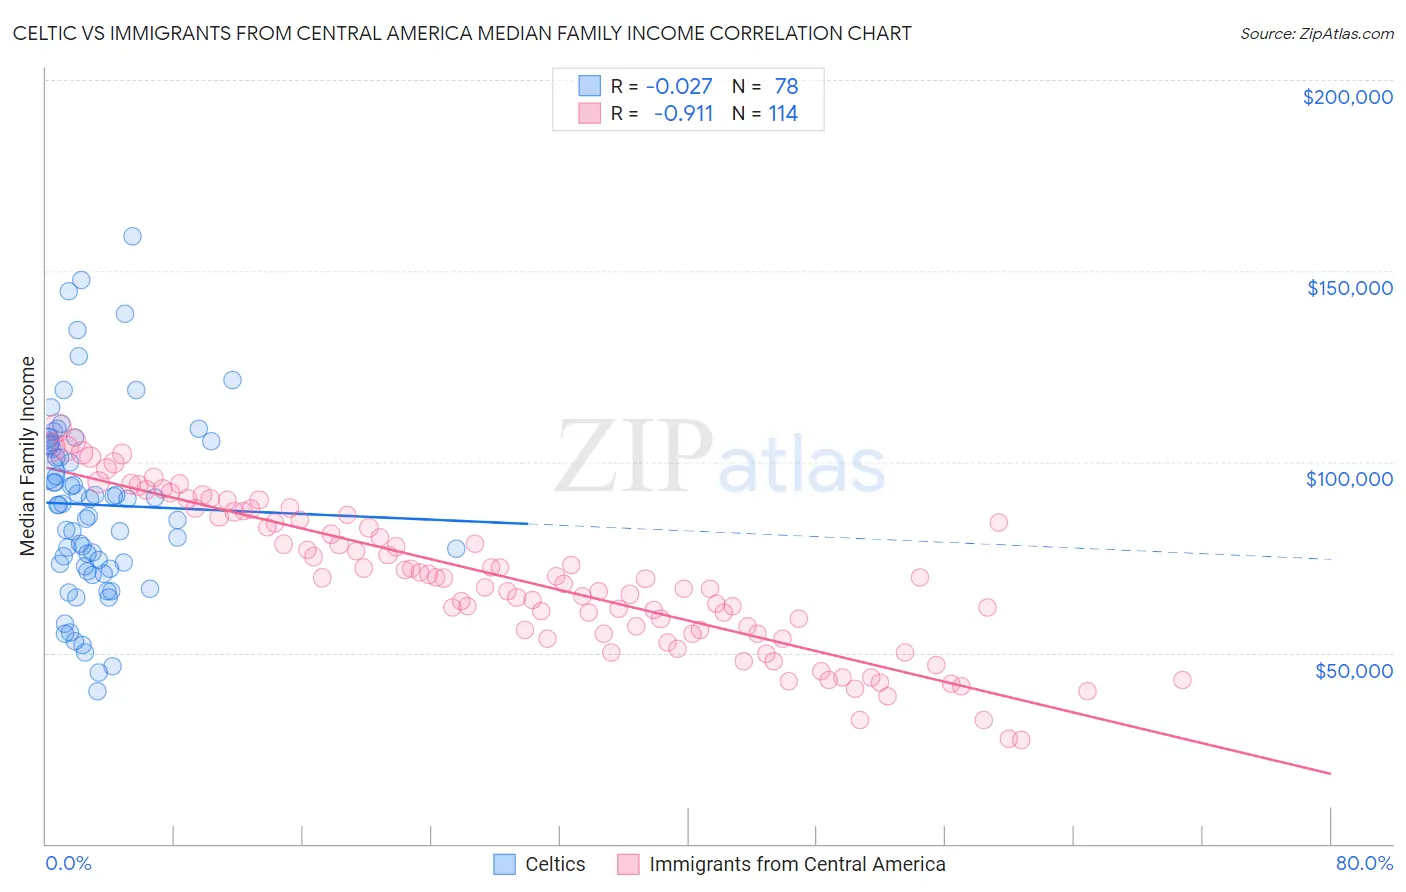
Celtic vs Immigrants from Central America Median Family Income Correlation Chart
The statistical analysis conducted on geographies consisting of 168,835,112 people shows no correlation between the proportion of Celtics and median family income in the United States with a correlation coefficient (R) of -0.027 and weighted average of $101,139. Similarly, the statistical analysis conducted on geographies consisting of 535,546,220 people shows a near-perfect negative correlation between the proportion of Immigrants from Central America and median family income in the United States with a correlation coefficient (R) of -0.911 and weighted average of $85,050, a difference of 18.9%.
Median Family Income Correlation Summary
| Measurement | Celtic | Immigrants from Central America |
| Minimum | $39,850 | $27,125 |
| Maximum | $159,107 | $108,930 |
| Range | $119,257 | $81,805 |
| Mean | $88,779 | $69,313 |
| Median | $88,800 | $69,476 |
| Interquartile 25% (IQ1) | $72,704 | $55,080 |
| Interquartile 75% (IQ3) | $104,459 | $85,500 |
| Interquartile Range (IQR) | $31,755 | $30,420 |
| Standard Deviation (Sample) | $24,372 | $19,367 |
| Standard Deviation (Population) | $24,216 | $19,282 |
Similar Demographics by Median Family Income
Demographics Similar to Celtics by Median Family Income
In terms of median family income, the demographic groups most similar to Celtics are Dutch ($101,192, a difference of 0.050%), Tlingit-Haida ($101,092, a difference of 0.050%), Guamanian/Chamorro ($101,061, a difference of 0.080%), Immigrants from Portugal ($100,984, a difference of 0.15%), and Immigrants ($100,962, a difference of 0.18%).
| Demographics | Rating | Rank | Median Family Income |
| South Americans | 39.7 /100 | #179 | Fair $101,856 |
| French Canadians | 37.0 /100 | #180 | Fair $101,634 |
| Spaniards | 36.8 /100 | #181 | Fair $101,617 |
| Tsimshian | 35.9 /100 | #182 | Fair $101,543 |
| Kenyans | 34.5 /100 | #183 | Fair $101,417 |
| Immigrants | Costa Rica | 33.7 /100 | #184 | Fair $101,354 |
| Dutch | 31.9 /100 | #185 | Fair $101,192 |
| Celtics | 31.3 /100 | #186 | Fair $101,139 |
| Tlingit-Haida | 30.8 /100 | #187 | Fair $101,092 |
| Guamanians/Chamorros | 30.5 /100 | #188 | Fair $101,061 |
| Immigrants | Portugal | 29.6 /100 | #189 | Fair $100,984 |
| Immigrants | Immigrants | 29.4 /100 | #190 | Fair $100,962 |
| Colombians | 27.2 /100 | #191 | Fair $100,750 |
| Immigrants | Kenya | 26.5 /100 | #192 | Fair $100,679 |
| Iraqis | 26.3 /100 | #193 | Fair $100,658 |
Demographics Similar to Immigrants from Central America by Median Family Income
In terms of median family income, the demographic groups most similar to Immigrants from Central America are Honduran ($85,004, a difference of 0.050%), Cuban ($84,981, a difference of 0.080%), Haitian ($85,218, a difference of 0.20%), Choctaw ($84,835, a difference of 0.25%), and U.S. Virgin Islander ($85,294, a difference of 0.29%).
| Demographics | Rating | Rank | Median Family Income |
| Hispanics or Latinos | 0.0 /100 | #303 | Tragic $85,647 |
| Mexicans | 0.0 /100 | #304 | Tragic $85,618 |
| Paiute | 0.0 /100 | #305 | Tragic $85,414 |
| Immigrants | Dominica | 0.0 /100 | #306 | Tragic $85,411 |
| Chickasaw | 0.0 /100 | #307 | Tragic $85,356 |
| U.S. Virgin Islanders | 0.0 /100 | #308 | Tragic $85,294 |
| Haitians | 0.0 /100 | #309 | Tragic $85,218 |
| Immigrants | Central America | 0.0 /100 | #310 | Tragic $85,050 |
| Hondurans | 0.0 /100 | #311 | Tragic $85,004 |
| Cubans | 0.0 /100 | #312 | Tragic $84,981 |
| Choctaw | 0.0 /100 | #313 | Tragic $84,835 |
| Immigrants | Bahamas | 0.0 /100 | #314 | Tragic $84,732 |
| Apache | 0.0 /100 | #315 | Tragic $84,451 |
| Immigrants | Haiti | 0.0 /100 | #316 | Tragic $84,018 |
| Yakama | 0.0 /100 | #317 | Tragic $83,932 |