Celtic vs Immigrants from Central America Householder Income Ages 45 - 64 years
COMPARE
Celtic
Immigrants from Central America
Householder Income Ages 45 - 64 years
Householder Income Ages 45 - 64 years Comparison
Celtics
Immigrants from Central America
$98,896
HOUSEHOLDER INCOME AGES 45 - 64 YEARS
32.9/ 100
METRIC RATING
192nd/ 347
METRIC RANK
$85,965
HOUSEHOLDER INCOME AGES 45 - 64 YEARS
0.1/ 100
METRIC RATING
292nd/ 347
METRIC RANK
Celtic vs Immigrants from Central America Householder Income Ages 45 - 64 years Correlation Chart
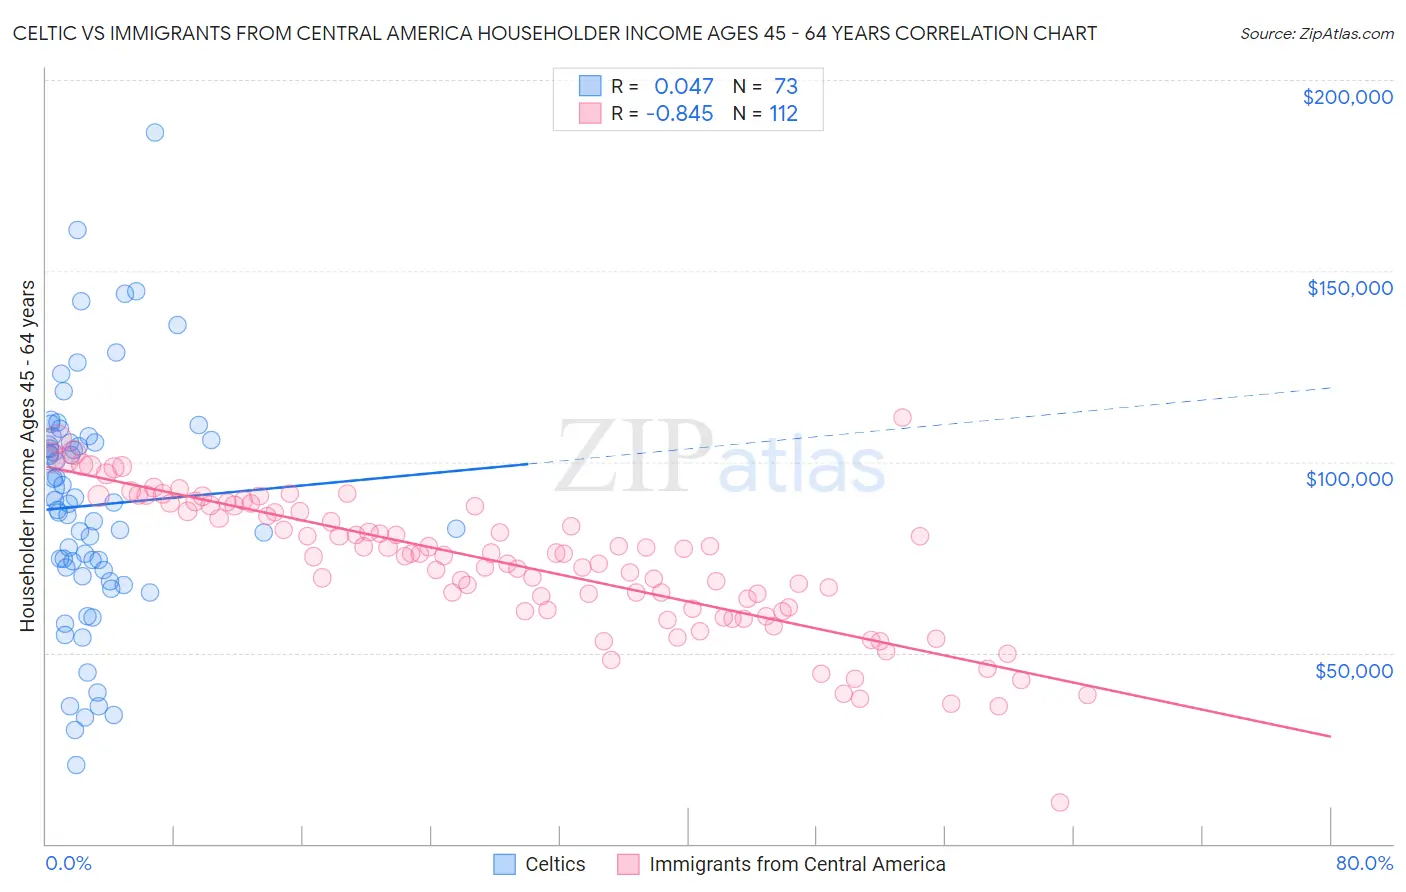
The statistical analysis conducted on geographies consisting of 168,784,150 people shows no correlation between the proportion of Celtics and household income with householder between the ages 45 and 64 in the United States with a correlation coefficient (R) of 0.047 and weighted average of $98,896. Similarly, the statistical analysis conducted on geographies consisting of 533,887,943 people shows a very strong negative correlation between the proportion of Immigrants from Central America and household income with householder between the ages 45 and 64 in the United States with a correlation coefficient (R) of -0.845 and weighted average of $85,965, a difference of 15.0%.
Householder Income Ages 45 - 64 years Correlation Summary
| Measurement | Celtic | Immigrants from Central America |
| Minimum | $20,731 | $10,788 |
| Maximum | $186,250 | $111,667 |
| Range | $165,519 | $100,879 |
| Mean | $88,627 | $73,521 |
| Median | $89,188 | $75,933 |
| Interquartile 25% (IQ1) | $70,916 | $61,476 |
| Interquartile 75% (IQ3) | $105,304 | $88,461 |
| Interquartile Range (IQR) | $34,388 | $26,985 |
| Standard Deviation (Sample) | $31,193 | $17,981 |
| Standard Deviation (Population) | $30,979 | $17,900 |
Similar Demographics by Householder Income Ages 45 - 64 years
Demographics Similar to Celtics by Householder Income Ages 45 - 64 years
In terms of householder income ages 45 - 64 years, the demographic groups most similar to Celtics are Kenyan ($98,970, a difference of 0.070%), Hawaiian ($98,778, a difference of 0.12%), French Canadian ($99,093, a difference of 0.20%), Immigrants from South America ($99,126, a difference of 0.23%), and Uruguayan ($98,660, a difference of 0.24%).
| Demographics | Rating | Rank | Householder Income Ages 45 - 64 years |
| Colombians | 43.2 /100 | #185 | Average $99,772 |
| Dutch | 41.7 /100 | #186 | Average $99,650 |
| Iraqis | 38.5 /100 | #187 | Fair $99,387 |
| Immigrants | Portugal | 36.3 /100 | #188 | Fair $99,203 |
| Immigrants | South America | 35.4 /100 | #189 | Fair $99,126 |
| French Canadians | 35.1 /100 | #190 | Fair $99,093 |
| Kenyans | 33.7 /100 | #191 | Fair $98,970 |
| Celtics | 32.9 /100 | #192 | Fair $98,896 |
| Hawaiians | 31.6 /100 | #193 | Fair $98,778 |
| Uruguayans | 30.3 /100 | #194 | Fair $98,660 |
| Spanish | 29.2 /100 | #195 | Fair $98,554 |
| Immigrants | Eastern Africa | 28.3 /100 | #196 | Fair $98,467 |
| Puget Sound Salish | 27.0 /100 | #197 | Fair $98,340 |
| Immigrants | Iraq | 25.7 /100 | #198 | Fair $98,201 |
| Whites/Caucasians | 24.6 /100 | #199 | Fair $98,091 |
Demographics Similar to Immigrants from Central America by Householder Income Ages 45 - 64 years
In terms of householder income ages 45 - 64 years, the demographic groups most similar to Immigrants from Central America are Hispanic or Latino ($86,006, a difference of 0.050%), Cherokee ($86,125, a difference of 0.19%), Comanche ($85,787, a difference of 0.21%), Cuban ($86,301, a difference of 0.39%), and British West Indian ($85,571, a difference of 0.46%).
| Demographics | Rating | Rank | Householder Income Ages 45 - 64 years |
| Blackfeet | 0.1 /100 | #285 | Tragic $86,595 |
| Immigrants | Guatemala | 0.1 /100 | #286 | Tragic $86,573 |
| Bangladeshis | 0.1 /100 | #287 | Tragic $86,402 |
| Immigrants | St. Vincent and the Grenadines | 0.1 /100 | #288 | Tragic $86,394 |
| Cubans | 0.1 /100 | #289 | Tragic $86,301 |
| Cherokee | 0.1 /100 | #290 | Tragic $86,125 |
| Hispanics or Latinos | 0.1 /100 | #291 | Tragic $86,006 |
| Immigrants | Central America | 0.1 /100 | #292 | Tragic $85,965 |
| Comanche | 0.1 /100 | #293 | Tragic $85,787 |
| British West Indians | 0.1 /100 | #294 | Tragic $85,571 |
| Immigrants | Grenada | 0.1 /100 | #295 | Tragic $85,552 |
| Immigrants | Zaire | 0.1 /100 | #296 | Tragic $85,207 |
| Fijians | 0.1 /100 | #297 | Tragic $85,187 |
| Africans | 0.0 /100 | #298 | Tragic $84,925 |
| Immigrants | Mexico | 0.0 /100 | #299 | Tragic $84,910 |