Celtic vs Immigrants from Cabo Verde Single Male Poverty
COMPARE
Celtic
Immigrants from Cabo Verde
Single Male Poverty
Single Male Poverty Comparison
Celtics
Immigrants from Cabo Verde
14.5%
SINGLE MALE POVERTY
0.0/ 100
METRIC RATING
286th/ 347
METRIC RANK
13.9%
SINGLE MALE POVERTY
0.1/ 100
METRIC RATING
266th/ 347
METRIC RANK
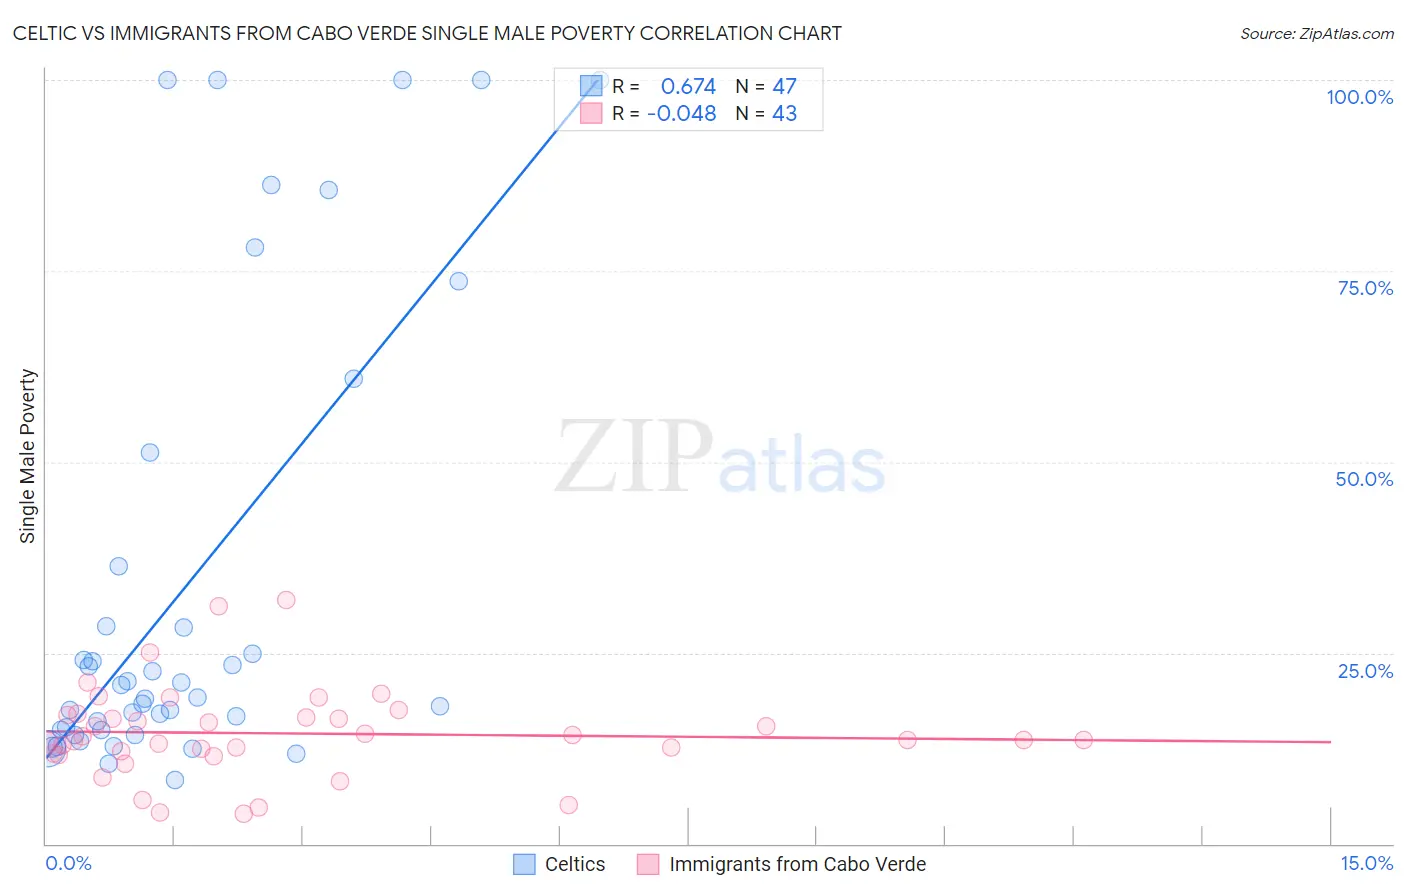
Celtic vs Immigrants from Cabo Verde Single Male Poverty Correlation Chart
The statistical analysis conducted on geographies consisting of 157,117,336 people shows a significant positive correlation between the proportion of Celtics and poverty level among single males in the United States with a correlation coefficient (R) of 0.674 and weighted average of 14.5%. Similarly, the statistical analysis conducted on geographies consisting of 36,518,320 people shows no correlation between the proportion of Immigrants from Cabo Verde and poverty level among single males in the United States with a correlation coefficient (R) of -0.048 and weighted average of 13.9%, a difference of 4.0%.
Single Male Poverty Correlation Summary
| Measurement | Celtic | Immigrants from Cabo Verde |
| Minimum | 8.3% | 4.0% |
| Maximum | 100.0% | 31.9% |
| Range | 91.7% | 27.9% |
| Mean | 33.9% | 14.4% |
| Median | 19.2% | 13.6% |
| Interquartile 25% (IQ1) | 14.9% | 11.8% |
| Interquartile 75% (IQ3) | 36.4% | 16.9% |
| Interquartile Range (IQR) | 21.5% | 5.2% |
| Standard Deviation (Sample) | 30.2% | 6.0% |
| Standard Deviation (Population) | 29.8% | 5.9% |
Demographics Similar to Celtics and Immigrants from Cabo Verde by Single Male Poverty
In terms of single male poverty, the demographic groups most similar to Celtics are French (14.4%, a difference of 0.32%), Immigrants from Bahamas (14.4%, a difference of 0.46%), Yaqui (14.2%, a difference of 1.6%), Spanish American (14.2%, a difference of 1.7%), and Hispanic or Latino (14.2%, a difference of 1.9%). Similarly, the demographic groups most similar to Immigrants from Cabo Verde are German (13.9%, a difference of 0.16%), Immigrants from Mexico (13.9%, a difference of 0.23%), Scottish (14.0%, a difference of 0.38%), Immigrants from Saudi Arabia (14.0%, a difference of 0.40%), and Irish (14.0%, a difference of 0.43%).
| Demographics | Rating | Rank | Single Male Poverty |
| Immigrants | Cabo Verde | 0.1 /100 | #266 | Tragic 13.9% |
| Germans | 0.1 /100 | #267 | Tragic 13.9% |
| Immigrants | Mexico | 0.1 /100 | #268 | Tragic 13.9% |
| Scottish | 0.1 /100 | #269 | Tragic 14.0% |
| Immigrants | Saudi Arabia | 0.1 /100 | #270 | Tragic 14.0% |
| Irish | 0.1 /100 | #271 | Tragic 14.0% |
| Mexicans | 0.1 /100 | #272 | Tragic 14.0% |
| Welsh | 0.1 /100 | #273 | Tragic 14.0% |
| Hondurans | 0.1 /100 | #274 | Tragic 14.0% |
| English | 0.1 /100 | #275 | Tragic 14.1% |
| Dutch | 0.1 /100 | #276 | Tragic 14.1% |
| Immigrants | Honduras | 0.0 /100 | #277 | Tragic 14.1% |
| Slovaks | 0.0 /100 | #278 | Tragic 14.1% |
| Indonesians | 0.0 /100 | #279 | Tragic 14.1% |
| Hmong | 0.0 /100 | #280 | Tragic 14.2% |
| Hispanics or Latinos | 0.0 /100 | #281 | Tragic 14.2% |
| Spanish Americans | 0.0 /100 | #282 | Tragic 14.2% |
| Yaqui | 0.0 /100 | #283 | Tragic 14.2% |
| Immigrants | Bahamas | 0.0 /100 | #284 | Tragic 14.4% |
| French | 0.0 /100 | #285 | Tragic 14.4% |
| Celtics | 0.0 /100 | #286 | Tragic 14.5% |