Peruvian vs Immigrants from Central America Single Male Poverty
COMPARE
Peruvian
Immigrants from Central America
Single Male Poverty
Single Male Poverty Comparison
Peruvians
Immigrants from Central America
11.8%
SINGLE MALE POVERTY
99.8/ 100
METRIC RATING
60th/ 347
METRIC RANK
13.8%
SINGLE MALE POVERTY
0.3/ 100
METRIC RATING
257th/ 347
METRIC RANK
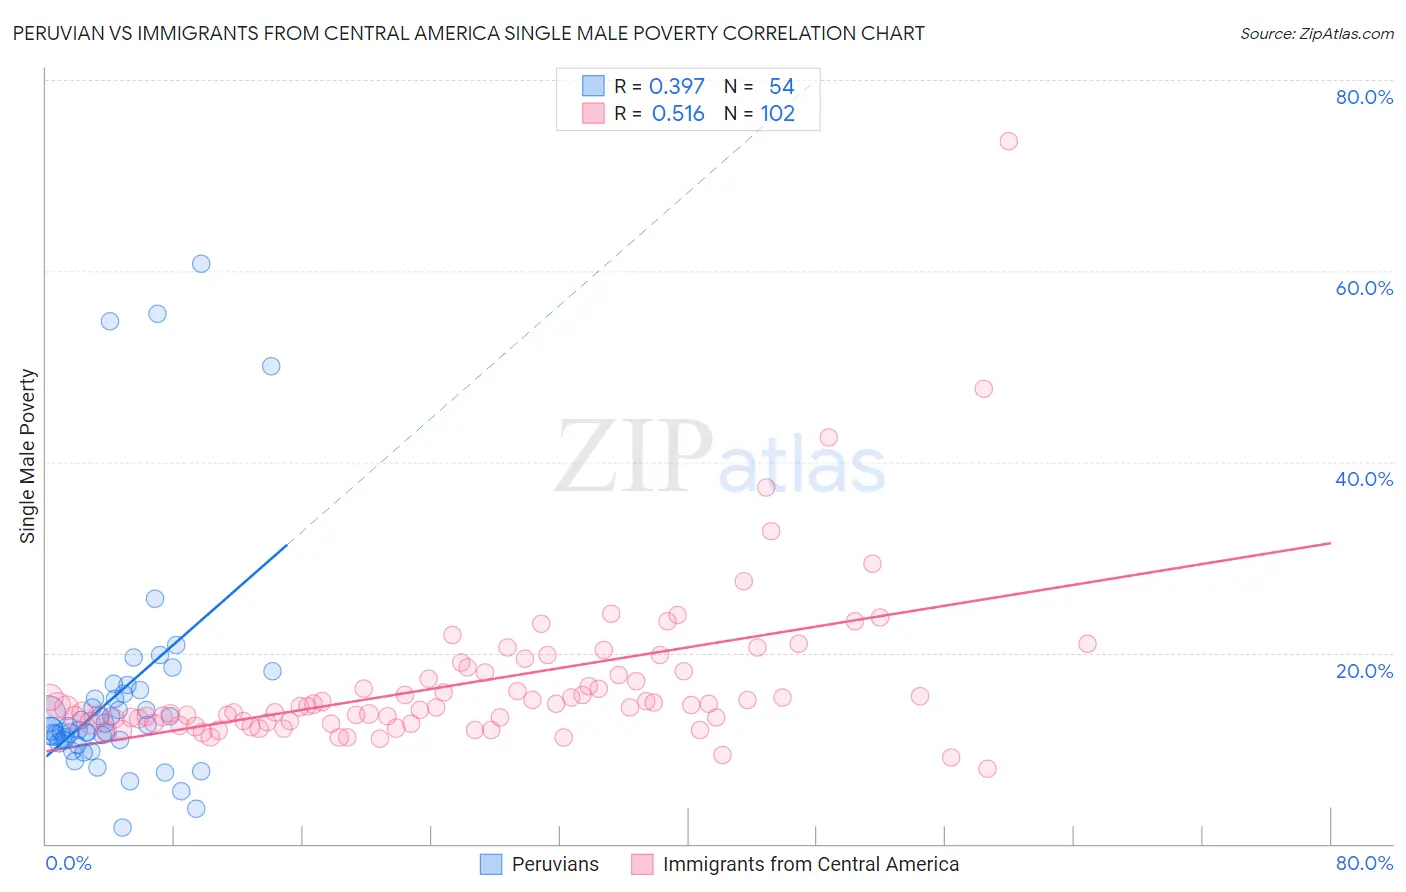
Peruvian vs Immigrants from Central America Single Male Poverty Correlation Chart
The statistical analysis conducted on geographies consisting of 326,481,306 people shows a mild positive correlation between the proportion of Peruvians and poverty level among single males in the United States with a correlation coefficient (R) of 0.397 and weighted average of 11.8%. Similarly, the statistical analysis conducted on geographies consisting of 454,315,872 people shows a substantial positive correlation between the proportion of Immigrants from Central America and poverty level among single males in the United States with a correlation coefficient (R) of 0.516 and weighted average of 13.8%, a difference of 16.8%.
Single Male Poverty Correlation Summary
| Measurement | Peruvian | Immigrants from Central America |
| Minimum | 1.7% | 7.9% |
| Maximum | 60.7% | 73.6% |
| Range | 59.0% | 65.7% |
| Mean | 15.6% | 16.8% |
| Median | 12.1% | 14.4% |
| Interquartile 25% (IQ1) | 10.9% | 12.7% |
| Interquartile 75% (IQ3) | 15.7% | 17.9% |
| Interquartile Range (IQR) | 4.8% | 5.2% |
| Standard Deviation (Sample) | 12.1% | 8.5% |
| Standard Deviation (Population) | 12.0% | 8.5% |
Similar Demographics by Single Male Poverty
Demographics Similar to Peruvians by Single Male Poverty
In terms of single male poverty, the demographic groups most similar to Peruvians are Cambodian (11.8%, a difference of 0.020%), Brazilian (11.8%, a difference of 0.21%), Immigrants from Brazil (11.7%, a difference of 0.29%), Immigrants from Romania (11.7%, a difference of 0.32%), and Immigrants from Sri Lanka (11.8%, a difference of 0.40%).
| Demographics | Rating | Rank | Single Male Poverty |
| Bulgarians | 99.9 /100 | #53 | Exceptional 11.7% |
| Immigrants | Uzbekistan | 99.9 /100 | #54 | Exceptional 11.7% |
| Cypriots | 99.9 /100 | #55 | Exceptional 11.7% |
| Burmese | 99.8 /100 | #56 | Exceptional 11.7% |
| Immigrants | Romania | 99.8 /100 | #57 | Exceptional 11.7% |
| Immigrants | Brazil | 99.8 /100 | #58 | Exceptional 11.7% |
| Brazilians | 99.8 /100 | #59 | Exceptional 11.8% |
| Peruvians | 99.8 /100 | #60 | Exceptional 11.8% |
| Cambodians | 99.8 /100 | #61 | Exceptional 11.8% |
| Immigrants | Sri Lanka | 99.7 /100 | #62 | Exceptional 11.8% |
| Immigrants | Belarus | 99.7 /100 | #63 | Exceptional 11.8% |
| Immigrants | Eastern Europe | 99.6 /100 | #64 | Exceptional 11.8% |
| Laotians | 99.6 /100 | #65 | Exceptional 11.9% |
| Immigrants | Uruguay | 99.6 /100 | #66 | Exceptional 11.9% |
| Immigrants | Ukraine | 99.6 /100 | #67 | Exceptional 11.9% |
Demographics Similar to Immigrants from Central America by Single Male Poverty
In terms of single male poverty, the demographic groups most similar to Immigrants from Central America are Immigrants from Guatemala (13.8%, a difference of 0.070%), Guatemalan (13.8%, a difference of 0.11%), Immigrants from Belize (13.7%, a difference of 0.18%), Swiss (13.8%, a difference of 0.18%), and Hungarian (13.8%, a difference of 0.23%).
| Demographics | Rating | Rank | Single Male Poverty |
| Immigrants | Somalia | 1.0 /100 | #250 | Tragic 13.6% |
| Immigrants | Zaire | 0.9 /100 | #251 | Tragic 13.6% |
| Finns | 0.9 /100 | #252 | Tragic 13.6% |
| German Russians | 0.8 /100 | #253 | Tragic 13.6% |
| Sub-Saharan Africans | 0.5 /100 | #254 | Tragic 13.7% |
| Spaniards | 0.4 /100 | #255 | Tragic 13.7% |
| Immigrants | Belize | 0.4 /100 | #256 | Tragic 13.7% |
| Immigrants | Central America | 0.3 /100 | #257 | Tragic 13.8% |
| Immigrants | Guatemala | 0.3 /100 | #258 | Tragic 13.8% |
| Guatemalans | 0.3 /100 | #259 | Tragic 13.8% |
| Swiss | 0.3 /100 | #260 | Tragic 13.8% |
| Hungarians | 0.3 /100 | #261 | Tragic 13.8% |
| Fijians | 0.3 /100 | #262 | Tragic 13.8% |
| Cape Verdeans | 0.2 /100 | #263 | Tragic 13.8% |
| West Indians | 0.2 /100 | #264 | Tragic 13.8% |