Celtic vs Peruvian Single Male Poverty
COMPARE
Celtic
Peruvian
Single Male Poverty
Single Male Poverty Comparison
Celtics
Peruvians
14.5%
SINGLE MALE POVERTY
0.0/ 100
METRIC RATING
286th/ 347
METRIC RANK
11.8%
SINGLE MALE POVERTY
99.8/ 100
METRIC RATING
60th/ 347
METRIC RANK
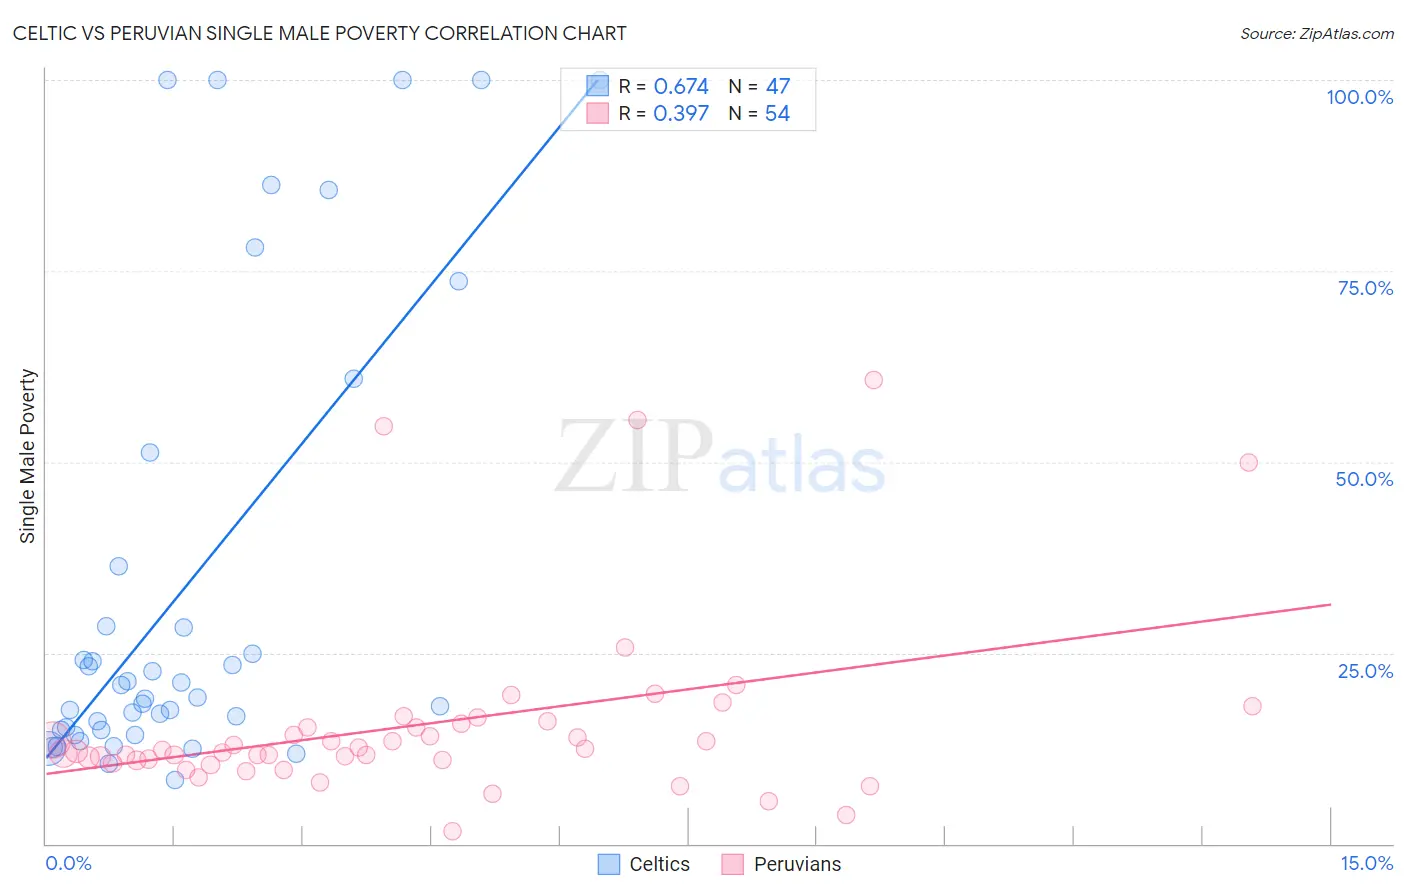
Celtic vs Peruvian Single Male Poverty Correlation Chart
The statistical analysis conducted on geographies consisting of 157,117,336 people shows a significant positive correlation between the proportion of Celtics and poverty level among single males in the United States with a correlation coefficient (R) of 0.674 and weighted average of 14.5%. Similarly, the statistical analysis conducted on geographies consisting of 326,481,306 people shows a mild positive correlation between the proportion of Peruvians and poverty level among single males in the United States with a correlation coefficient (R) of 0.397 and weighted average of 11.8%, a difference of 22.8%.
Single Male Poverty Correlation Summary
| Measurement | Celtic | Peruvian |
| Minimum | 8.3% | 1.7% |
| Maximum | 100.0% | 60.7% |
| Range | 91.7% | 59.0% |
| Mean | 33.9% | 15.6% |
| Median | 19.2% | 12.1% |
| Interquartile 25% (IQ1) | 14.9% | 10.9% |
| Interquartile 75% (IQ3) | 36.4% | 15.7% |
| Interquartile Range (IQR) | 21.5% | 4.8% |
| Standard Deviation (Sample) | 30.2% | 12.1% |
| Standard Deviation (Population) | 29.8% | 12.0% |
Similar Demographics by Single Male Poverty
Demographics Similar to Celtics by Single Male Poverty
In terms of single male poverty, the demographic groups most similar to Celtics are Iroquois (14.5%, a difference of 0.13%), White/Caucasian (14.5%, a difference of 0.13%), Immigrants from Dominica (14.5%, a difference of 0.22%), French (14.4%, a difference of 0.32%), and U.S. Virgin Islander (14.5%, a difference of 0.44%).
| Demographics | Rating | Rank | Single Male Poverty |
| Indonesians | 0.0 /100 | #279 | Tragic 14.1% |
| Hmong | 0.0 /100 | #280 | Tragic 14.2% |
| Hispanics or Latinos | 0.0 /100 | #281 | Tragic 14.2% |
| Spanish Americans | 0.0 /100 | #282 | Tragic 14.2% |
| Yaqui | 0.0 /100 | #283 | Tragic 14.2% |
| Immigrants | Bahamas | 0.0 /100 | #284 | Tragic 14.4% |
| French | 0.0 /100 | #285 | Tragic 14.4% |
| Celtics | 0.0 /100 | #286 | Tragic 14.5% |
| Iroquois | 0.0 /100 | #287 | Tragic 14.5% |
| Whites/Caucasians | 0.0 /100 | #288 | Tragic 14.5% |
| Immigrants | Dominica | 0.0 /100 | #289 | Tragic 14.5% |
| U.S. Virgin Islanders | 0.0 /100 | #290 | Tragic 14.5% |
| Bahamians | 0.0 /100 | #291 | Tragic 14.6% |
| Immigrants | Nonimmigrants | 0.0 /100 | #292 | Tragic 14.6% |
| French Canadians | 0.0 /100 | #293 | Tragic 14.6% |
Demographics Similar to Peruvians by Single Male Poverty
In terms of single male poverty, the demographic groups most similar to Peruvians are Cambodian (11.8%, a difference of 0.020%), Brazilian (11.8%, a difference of 0.21%), Immigrants from Brazil (11.7%, a difference of 0.29%), Immigrants from Romania (11.7%, a difference of 0.32%), and Immigrants from Sri Lanka (11.8%, a difference of 0.40%).
| Demographics | Rating | Rank | Single Male Poverty |
| Bulgarians | 99.9 /100 | #53 | Exceptional 11.7% |
| Immigrants | Uzbekistan | 99.9 /100 | #54 | Exceptional 11.7% |
| Cypriots | 99.9 /100 | #55 | Exceptional 11.7% |
| Burmese | 99.8 /100 | #56 | Exceptional 11.7% |
| Immigrants | Romania | 99.8 /100 | #57 | Exceptional 11.7% |
| Immigrants | Brazil | 99.8 /100 | #58 | Exceptional 11.7% |
| Brazilians | 99.8 /100 | #59 | Exceptional 11.8% |
| Peruvians | 99.8 /100 | #60 | Exceptional 11.8% |
| Cambodians | 99.8 /100 | #61 | Exceptional 11.8% |
| Immigrants | Sri Lanka | 99.7 /100 | #62 | Exceptional 11.8% |
| Immigrants | Belarus | 99.7 /100 | #63 | Exceptional 11.8% |
| Immigrants | Eastern Europe | 99.6 /100 | #64 | Exceptional 11.8% |
| Laotians | 99.6 /100 | #65 | Exceptional 11.9% |
| Immigrants | Uruguay | 99.6 /100 | #66 | Exceptional 11.9% |
| Immigrants | Ukraine | 99.6 /100 | #67 | Exceptional 11.9% |