Celtic vs Ukrainian Single Male Poverty
COMPARE
Celtic
Ukrainian
Single Male Poverty
Single Male Poverty Comparison
Celtics
Ukrainians
14.5%
SINGLE MALE POVERTY
0.0/ 100
METRIC RATING
286th/ 347
METRIC RANK
12.6%
SINGLE MALE POVERTY
80.7/ 100
METRIC RATING
137th/ 347
METRIC RANK
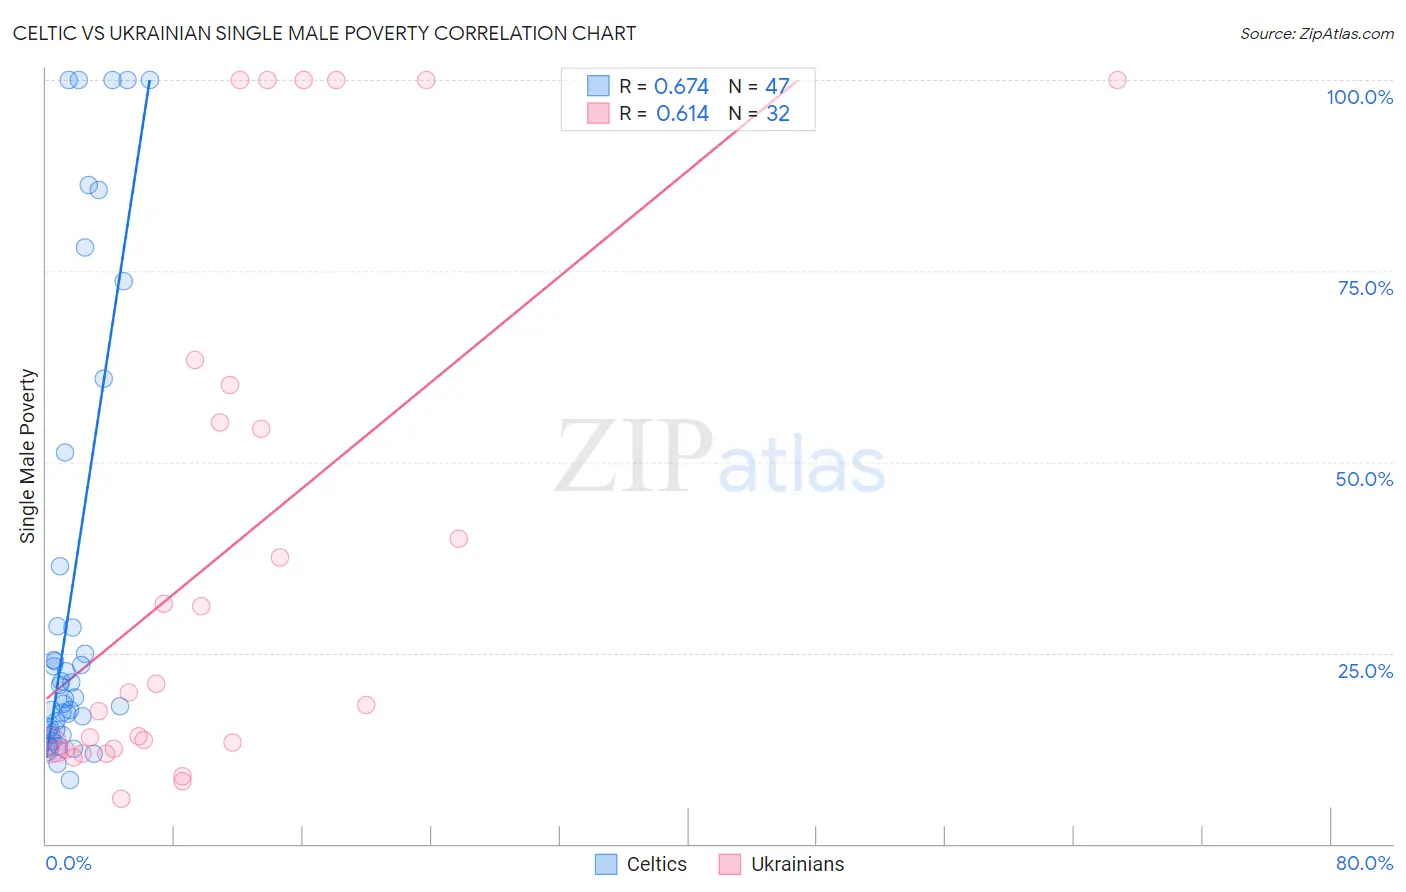
Celtic vs Ukrainian Single Male Poverty Correlation Chart
The statistical analysis conducted on geographies consisting of 157,117,336 people shows a significant positive correlation between the proportion of Celtics and poverty level among single males in the United States with a correlation coefficient (R) of 0.674 and weighted average of 14.5%. Similarly, the statistical analysis conducted on geographies consisting of 384,483,508 people shows a significant positive correlation between the proportion of Ukrainians and poverty level among single males in the United States with a correlation coefficient (R) of 0.614 and weighted average of 12.6%, a difference of 15.2%.
Single Male Poverty Correlation Summary
| Measurement | Celtic | Ukrainian |
| Minimum | 8.3% | 6.0% |
| Maximum | 100.0% | 100.0% |
| Range | 91.7% | 94.0% |
| Mean | 33.9% | 37.9% |
| Median | 19.2% | 19.0% |
| Interquartile 25% (IQ1) | 14.9% | 12.3% |
| Interquartile 75% (IQ3) | 36.4% | 57.6% |
| Interquartile Range (IQR) | 21.5% | 45.2% |
| Standard Deviation (Sample) | 30.2% | 34.1% |
| Standard Deviation (Population) | 29.8% | 33.6% |
Similar Demographics by Single Male Poverty
Demographics Similar to Celtics by Single Male Poverty
In terms of single male poverty, the demographic groups most similar to Celtics are Iroquois (14.5%, a difference of 0.13%), White/Caucasian (14.5%, a difference of 0.13%), Immigrants from Dominica (14.5%, a difference of 0.22%), French (14.4%, a difference of 0.32%), and U.S. Virgin Islander (14.5%, a difference of 0.44%).
| Demographics | Rating | Rank | Single Male Poverty |
| Indonesians | 0.0 /100 | #279 | Tragic 14.1% |
| Hmong | 0.0 /100 | #280 | Tragic 14.2% |
| Hispanics or Latinos | 0.0 /100 | #281 | Tragic 14.2% |
| Spanish Americans | 0.0 /100 | #282 | Tragic 14.2% |
| Yaqui | 0.0 /100 | #283 | Tragic 14.2% |
| Immigrants | Bahamas | 0.0 /100 | #284 | Tragic 14.4% |
| French | 0.0 /100 | #285 | Tragic 14.4% |
| Celtics | 0.0 /100 | #286 | Tragic 14.5% |
| Iroquois | 0.0 /100 | #287 | Tragic 14.5% |
| Whites/Caucasians | 0.0 /100 | #288 | Tragic 14.5% |
| Immigrants | Dominica | 0.0 /100 | #289 | Tragic 14.5% |
| U.S. Virgin Islanders | 0.0 /100 | #290 | Tragic 14.5% |
| Bahamians | 0.0 /100 | #291 | Tragic 14.6% |
| Immigrants | Nonimmigrants | 0.0 /100 | #292 | Tragic 14.6% |
| French Canadians | 0.0 /100 | #293 | Tragic 14.6% |
Demographics Similar to Ukrainians by Single Male Poverty
In terms of single male poverty, the demographic groups most similar to Ukrainians are Immigrants from El Salvador (12.6%, a difference of 0.060%), Cuban (12.6%, a difference of 0.070%), Immigrants from Costa Rica (12.5%, a difference of 0.11%), Immigrants from Austria (12.5%, a difference of 0.11%), and Immigrants from Ecuador (12.5%, a difference of 0.12%).
| Demographics | Rating | Rank | Single Male Poverty |
| Immigrants | Nicaragua | 84.8 /100 | #130 | Excellent 12.5% |
| Immigrants | Northern Europe | 83.7 /100 | #131 | Excellent 12.5% |
| Salvadorans | 83.7 /100 | #132 | Excellent 12.5% |
| Immigrants | Western Asia | 83.4 /100 | #133 | Excellent 12.5% |
| Immigrants | Ecuador | 82.1 /100 | #134 | Excellent 12.5% |
| Immigrants | Costa Rica | 81.9 /100 | #135 | Excellent 12.5% |
| Immigrants | Austria | 81.9 /100 | #136 | Excellent 12.5% |
| Ukrainians | 80.7 /100 | #137 | Excellent 12.6% |
| Immigrants | El Salvador | 80.0 /100 | #138 | Excellent 12.6% |
| Cubans | 79.9 /100 | #139 | Good 12.6% |
| Immigrants | Zimbabwe | 78.0 /100 | #140 | Good 12.6% |
| Okinawans | 75.9 /100 | #141 | Good 12.6% |
| Immigrants | Uganda | 75.9 /100 | #142 | Good 12.6% |
| Immigrants | France | 75.8 /100 | #143 | Good 12.6% |
| Hawaiians | 75.1 /100 | #144 | Good 12.6% |