Celtic vs British West Indian Single Male Poverty
COMPARE
Celtic
British West Indian
Single Male Poverty
Single Male Poverty Comparison
Celtics
British West Indians
14.5%
SINGLE MALE POVERTY
0.0/ 100
METRIC RATING
286th/ 347
METRIC RANK
13.4%
SINGLE MALE POVERTY
3.4/ 100
METRIC RATING
237th/ 347
METRIC RANK
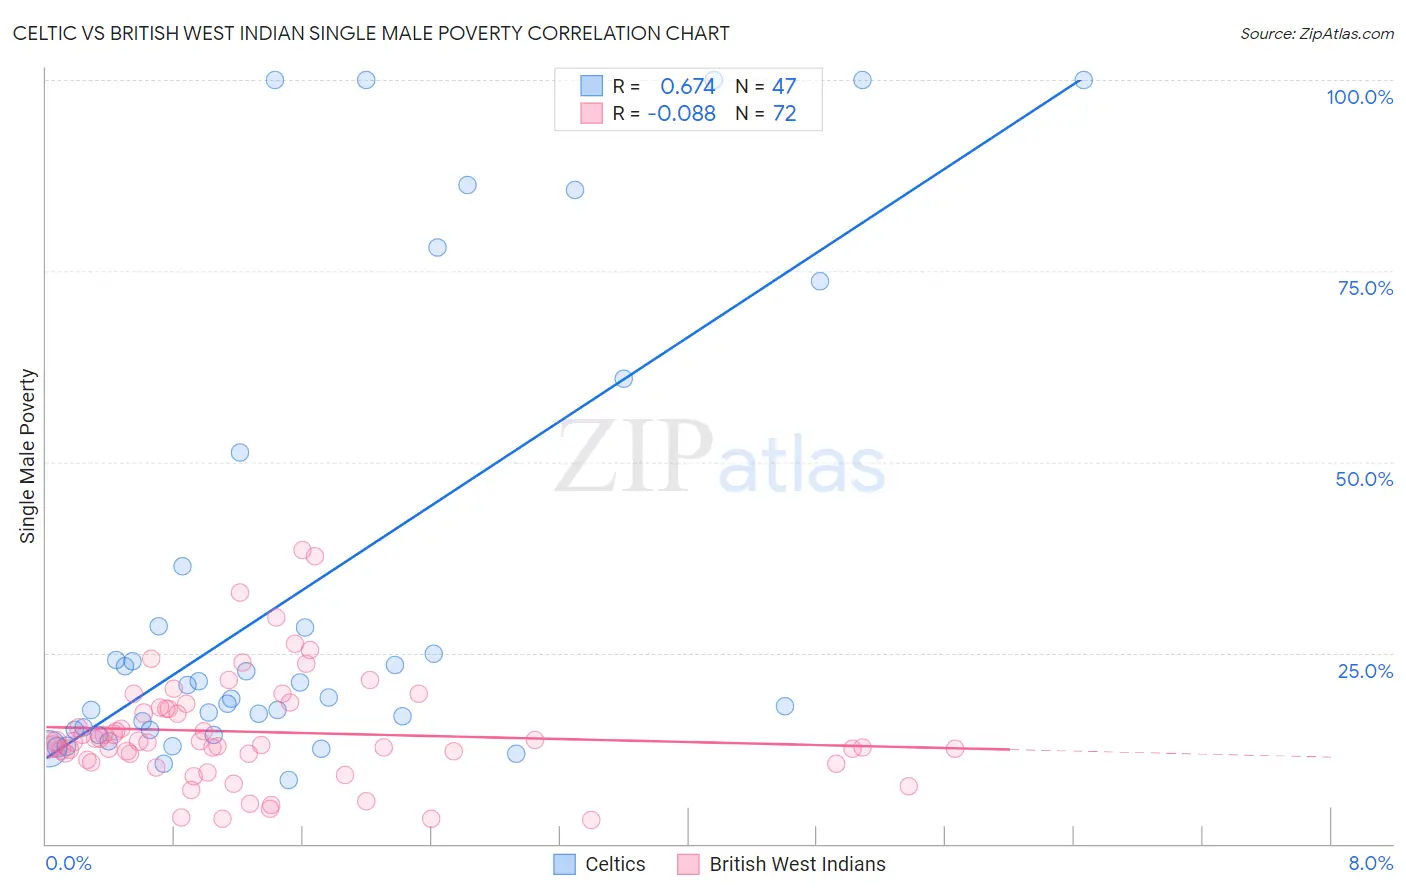
Celtic vs British West Indian Single Male Poverty Correlation Chart
The statistical analysis conducted on geographies consisting of 157,117,336 people shows a significant positive correlation between the proportion of Celtics and poverty level among single males in the United States with a correlation coefficient (R) of 0.674 and weighted average of 14.5%. Similarly, the statistical analysis conducted on geographies consisting of 145,852,012 people shows a slight negative correlation between the proportion of British West Indians and poverty level among single males in the United States with a correlation coefficient (R) of -0.088 and weighted average of 13.4%, a difference of 8.3%.
Single Male Poverty Correlation Summary
| Measurement | Celtic | British West Indian |
| Minimum | 8.3% | 3.1% |
| Maximum | 100.0% | 38.5% |
| Range | 91.7% | 35.3% |
| Mean | 33.9% | 14.6% |
| Median | 19.2% | 13.3% |
| Interquartile 25% (IQ1) | 14.9% | 11.3% |
| Interquartile 75% (IQ3) | 36.4% | 17.8% |
| Interquartile Range (IQR) | 21.5% | 6.4% |
| Standard Deviation (Sample) | 30.2% | 7.2% |
| Standard Deviation (Population) | 29.8% | 7.2% |
Similar Demographics by Single Male Poverty
Demographics Similar to Celtics by Single Male Poverty
In terms of single male poverty, the demographic groups most similar to Celtics are Iroquois (14.5%, a difference of 0.13%), White/Caucasian (14.5%, a difference of 0.13%), Immigrants from Dominica (14.5%, a difference of 0.22%), French (14.4%, a difference of 0.32%), and U.S. Virgin Islander (14.5%, a difference of 0.44%).
| Demographics | Rating | Rank | Single Male Poverty |
| Indonesians | 0.0 /100 | #279 | Tragic 14.1% |
| Hmong | 0.0 /100 | #280 | Tragic 14.2% |
| Hispanics or Latinos | 0.0 /100 | #281 | Tragic 14.2% |
| Spanish Americans | 0.0 /100 | #282 | Tragic 14.2% |
| Yaqui | 0.0 /100 | #283 | Tragic 14.2% |
| Immigrants | Bahamas | 0.0 /100 | #284 | Tragic 14.4% |
| French | 0.0 /100 | #285 | Tragic 14.4% |
| Celtics | 0.0 /100 | #286 | Tragic 14.5% |
| Iroquois | 0.0 /100 | #287 | Tragic 14.5% |
| Whites/Caucasians | 0.0 /100 | #288 | Tragic 14.5% |
| Immigrants | Dominica | 0.0 /100 | #289 | Tragic 14.5% |
| U.S. Virgin Islanders | 0.0 /100 | #290 | Tragic 14.5% |
| Bahamians | 0.0 /100 | #291 | Tragic 14.6% |
| Immigrants | Nonimmigrants | 0.0 /100 | #292 | Tragic 14.6% |
| French Canadians | 0.0 /100 | #293 | Tragic 14.6% |
Demographics Similar to British West Indians by Single Male Poverty
In terms of single male poverty, the demographic groups most similar to British West Indians are Luxembourger (13.4%, a difference of 0.060%), Immigrants from Ghana (13.4%, a difference of 0.10%), Bangladeshi (13.3%, a difference of 0.11%), Czechoslovakian (13.4%, a difference of 0.18%), and British (13.3%, a difference of 0.21%).
| Demographics | Rating | Rank | Single Male Poverty |
| Ghanaians | 6.1 /100 | #230 | Tragic 13.3% |
| Slavs | 5.3 /100 | #231 | Tragic 13.3% |
| Immigrants | Caribbean | 5.0 /100 | #232 | Tragic 13.3% |
| British | 4.0 /100 | #233 | Tragic 13.3% |
| Canadians | 4.0 /100 | #234 | Tragic 13.3% |
| Bangladeshis | 3.7 /100 | #235 | Tragic 13.3% |
| Luxembourgers | 3.6 /100 | #236 | Tragic 13.4% |
| British West Indians | 3.4 /100 | #237 | Tragic 13.4% |
| Immigrants | Ghana | 3.2 /100 | #238 | Tragic 13.4% |
| Czechoslovakians | 3.0 /100 | #239 | Tragic 13.4% |
| Belizeans | 2.3 /100 | #240 | Tragic 13.4% |
| Immigrants | Germany | 2.1 /100 | #241 | Tragic 13.4% |
| Carpatho Rusyns | 2.1 /100 | #242 | Tragic 13.4% |
| Barbadians | 2.1 /100 | #243 | Tragic 13.4% |
| Immigrants | Senegal | 1.7 /100 | #244 | Tragic 13.5% |