Celtic vs Basque Single Male Poverty
COMPARE
Celtic
Basque
Single Male Poverty
Single Male Poverty Comparison
Celtics
Basques
14.5%
SINGLE MALE POVERTY
0.0/ 100
METRIC RATING
286th/ 347
METRIC RANK
13.0%
SINGLE MALE POVERTY
20.7/ 100
METRIC RATING
202nd/ 347
METRIC RANK
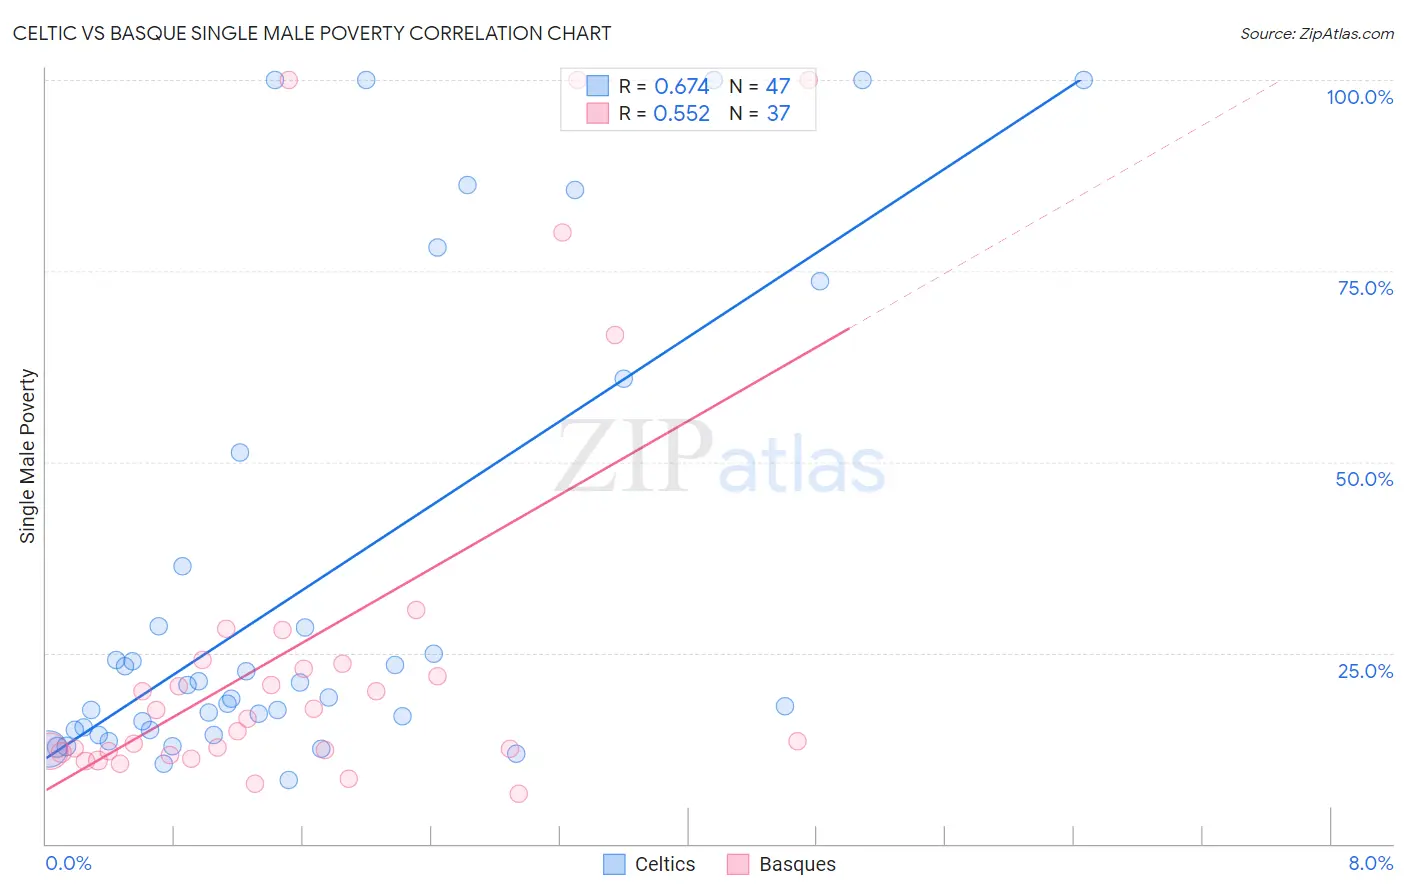
Celtic vs Basque Single Male Poverty Correlation Chart
The statistical analysis conducted on geographies consisting of 157,117,336 people shows a significant positive correlation between the proportion of Celtics and poverty level among single males in the United States with a correlation coefficient (R) of 0.674 and weighted average of 14.5%. Similarly, the statistical analysis conducted on geographies consisting of 155,521,610 people shows a substantial positive correlation between the proportion of Basques and poverty level among single males in the United States with a correlation coefficient (R) of 0.552 and weighted average of 13.0%, a difference of 11.1%.
Single Male Poverty Correlation Summary
| Measurement | Celtic | Basque |
| Minimum | 8.3% | 6.6% |
| Maximum | 100.0% | 100.0% |
| Range | 91.7% | 93.4% |
| Mean | 33.9% | 26.0% |
| Median | 19.2% | 16.3% |
| Interquartile 25% (IQ1) | 14.9% | 12.0% |
| Interquartile 75% (IQ3) | 36.4% | 23.8% |
| Interquartile Range (IQR) | 21.5% | 11.8% |
| Standard Deviation (Sample) | 30.2% | 26.5% |
| Standard Deviation (Population) | 29.8% | 26.2% |
Similar Demographics by Single Male Poverty
Demographics Similar to Celtics by Single Male Poverty
In terms of single male poverty, the demographic groups most similar to Celtics are Iroquois (14.5%, a difference of 0.13%), White/Caucasian (14.5%, a difference of 0.13%), Immigrants from Dominica (14.5%, a difference of 0.22%), French (14.4%, a difference of 0.32%), and U.S. Virgin Islander (14.5%, a difference of 0.44%).
| Demographics | Rating | Rank | Single Male Poverty |
| Indonesians | 0.0 /100 | #279 | Tragic 14.1% |
| Hmong | 0.0 /100 | #280 | Tragic 14.2% |
| Hispanics or Latinos | 0.0 /100 | #281 | Tragic 14.2% |
| Spanish Americans | 0.0 /100 | #282 | Tragic 14.2% |
| Yaqui | 0.0 /100 | #283 | Tragic 14.2% |
| Immigrants | Bahamas | 0.0 /100 | #284 | Tragic 14.4% |
| French | 0.0 /100 | #285 | Tragic 14.4% |
| Celtics | 0.0 /100 | #286 | Tragic 14.5% |
| Iroquois | 0.0 /100 | #287 | Tragic 14.5% |
| Whites/Caucasians | 0.0 /100 | #288 | Tragic 14.5% |
| Immigrants | Dominica | 0.0 /100 | #289 | Tragic 14.5% |
| U.S. Virgin Islanders | 0.0 /100 | #290 | Tragic 14.5% |
| Bahamians | 0.0 /100 | #291 | Tragic 14.6% |
| Immigrants | Nonimmigrants | 0.0 /100 | #292 | Tragic 14.6% |
| French Canadians | 0.0 /100 | #293 | Tragic 14.6% |
Demographics Similar to Basques by Single Male Poverty
In terms of single male poverty, the demographic groups most similar to Basques are Immigrants from Bangladesh (13.0%, a difference of 0.030%), Estonian (13.0%, a difference of 0.030%), Trinidadian and Tobagonian (13.0%, a difference of 0.060%), Slovene (13.0%, a difference of 0.070%), and Immigrants from Norway (13.0%, a difference of 0.090%).
| Demographics | Rating | Rank | Single Male Poverty |
| Immigrants | England | 23.4 /100 | #195 | Fair 13.0% |
| Immigrants | Grenada | 23.1 /100 | #196 | Fair 13.0% |
| Immigrants | Laos | 23.1 /100 | #197 | Fair 13.0% |
| Lithuanians | 22.1 /100 | #198 | Fair 13.0% |
| Immigrants | Norway | 21.8 /100 | #199 | Fair 13.0% |
| Slovenes | 21.6 /100 | #200 | Fair 13.0% |
| Trinidadians and Tobagonians | 21.4 /100 | #201 | Fair 13.0% |
| Basques | 20.7 /100 | #202 | Fair 13.0% |
| Immigrants | Bangladesh | 20.4 /100 | #203 | Fair 13.0% |
| Estonians | 20.3 /100 | #204 | Fair 13.0% |
| Poles | 19.3 /100 | #205 | Poor 13.0% |
| Northern Europeans | 18.9 /100 | #206 | Poor 13.0% |
| Sudanese | 17.7 /100 | #207 | Poor 13.1% |
| Immigrants | Western Africa | 17.6 /100 | #208 | Poor 13.1% |
| Mexican American Indians | 17.5 /100 | #209 | Poor 13.1% |