Immigrants from Oceania vs Immigrants from Central America Single Male Poverty
COMPARE
Immigrants from Oceania
Immigrants from Central America
Single Male Poverty
Single Male Poverty Comparison
Immigrants from Oceania
Immigrants from Central America
12.4%
SINGLE MALE POVERTY
91.1/ 100
METRIC RATING
117th/ 347
METRIC RANK
13.8%
SINGLE MALE POVERTY
0.3/ 100
METRIC RATING
257th/ 347
METRIC RANK
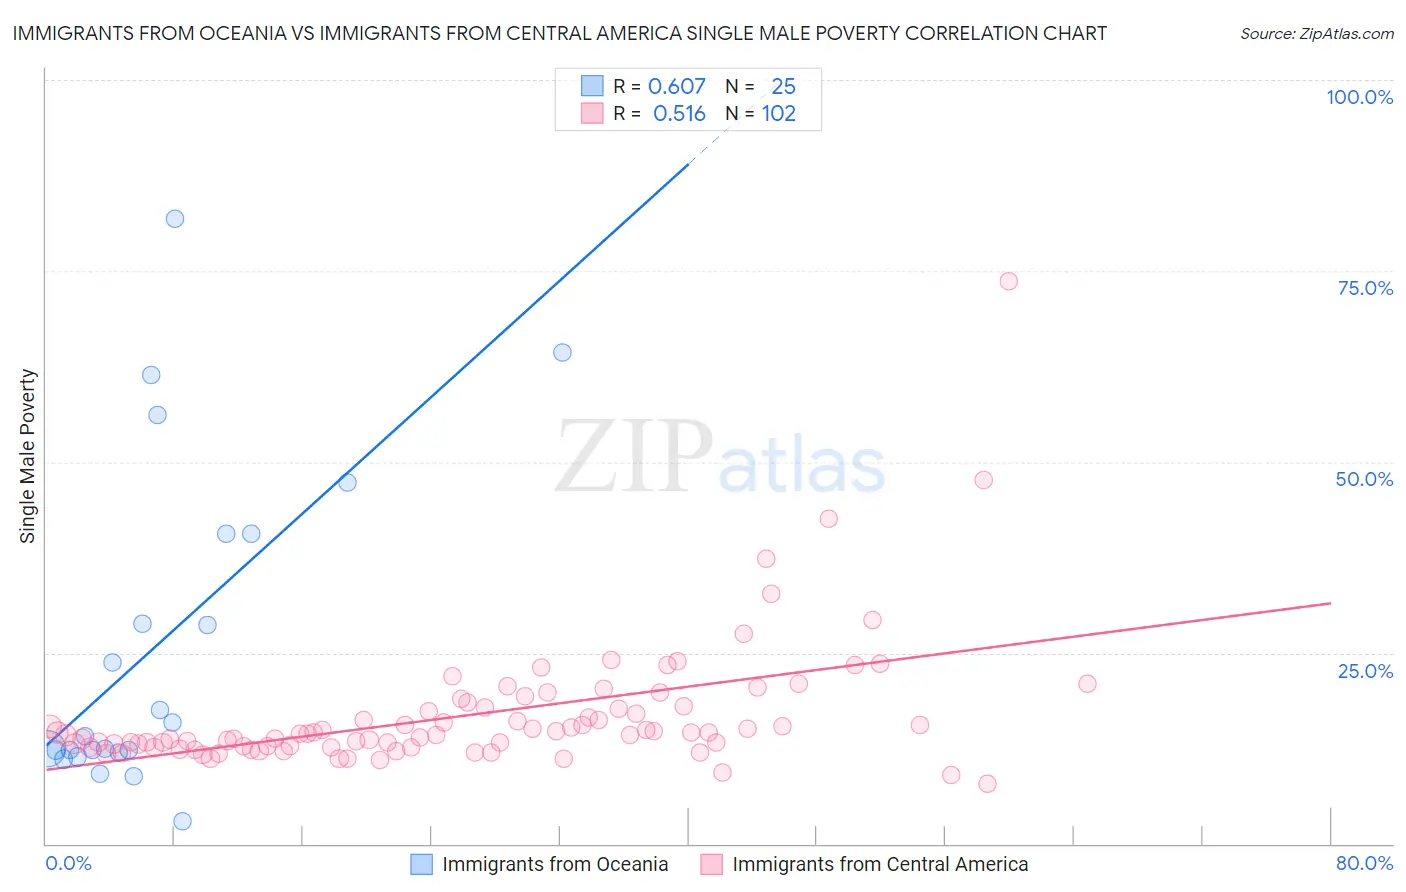
Immigrants from Oceania vs Immigrants from Central America Single Male Poverty Correlation Chart
The statistical analysis conducted on geographies consisting of 275,455,617 people shows a significant positive correlation between the proportion of Immigrants from Oceania and poverty level among single males in the United States with a correlation coefficient (R) of 0.607 and weighted average of 12.4%. Similarly, the statistical analysis conducted on geographies consisting of 454,315,872 people shows a substantial positive correlation between the proportion of Immigrants from Central America and poverty level among single males in the United States with a correlation coefficient (R) of 0.516 and weighted average of 13.8%, a difference of 10.9%.
Single Male Poverty Correlation Summary
| Measurement | Immigrants from Oceania | Immigrants from Central America |
| Minimum | 3.0% | 7.9% |
| Maximum | 81.8% | 73.6% |
| Range | 78.9% | 65.7% |
| Mean | 26.0% | 16.8% |
| Median | 14.1% | 14.4% |
| Interquartile 25% (IQ1) | 12.1% | 12.7% |
| Interquartile 75% (IQ3) | 40.5% | 17.9% |
| Interquartile Range (IQR) | 28.4% | 5.2% |
| Standard Deviation (Sample) | 21.2% | 8.5% |
| Standard Deviation (Population) | 20.8% | 8.5% |
Similar Demographics by Single Male Poverty
Demographics Similar to Immigrants from Oceania by Single Male Poverty
In terms of single male poverty, the demographic groups most similar to Immigrants from Oceania are Immigrants from Syria (12.4%, a difference of 0.010%), Immigrants from Southern Europe (12.4%, a difference of 0.070%), Albanian (12.4%, a difference of 0.10%), Immigrants from Albania (12.4%, a difference of 0.13%), and Nicaraguan (12.4%, a difference of 0.18%).
| Demographics | Rating | Rank | Single Male Poverty |
| Immigrants | Portugal | 93.6 /100 | #110 | Exceptional 12.3% |
| Immigrants | North Macedonia | 93.6 /100 | #111 | Exceptional 12.3% |
| Kenyans | 93.3 /100 | #112 | Exceptional 12.4% |
| Pakistanis | 92.4 /100 | #113 | Exceptional 12.4% |
| Nicaraguans | 92.1 /100 | #114 | Exceptional 12.4% |
| Immigrants | Southern Europe | 91.5 /100 | #115 | Exceptional 12.4% |
| Immigrants | Syria | 91.2 /100 | #116 | Exceptional 12.4% |
| Immigrants | Oceania | 91.1 /100 | #117 | Exceptional 12.4% |
| Albanians | 90.6 /100 | #118 | Exceptional 12.4% |
| Immigrants | Albania | 90.3 /100 | #119 | Exceptional 12.4% |
| Venezuelans | 89.4 /100 | #120 | Excellent 12.4% |
| Icelanders | 88.2 /100 | #121 | Excellent 12.5% |
| Serbians | 87.9 /100 | #122 | Excellent 12.5% |
| Immigrants | Kenya | 87.6 /100 | #123 | Excellent 12.5% |
| Russians | 87.3 /100 | #124 | Excellent 12.5% |
Demographics Similar to Immigrants from Central America by Single Male Poverty
In terms of single male poverty, the demographic groups most similar to Immigrants from Central America are Immigrants from Guatemala (13.8%, a difference of 0.070%), Guatemalan (13.8%, a difference of 0.11%), Immigrants from Belize (13.7%, a difference of 0.18%), Swiss (13.8%, a difference of 0.18%), and Hungarian (13.8%, a difference of 0.23%).
| Demographics | Rating | Rank | Single Male Poverty |
| Immigrants | Somalia | 1.0 /100 | #250 | Tragic 13.6% |
| Immigrants | Zaire | 0.9 /100 | #251 | Tragic 13.6% |
| Finns | 0.9 /100 | #252 | Tragic 13.6% |
| German Russians | 0.8 /100 | #253 | Tragic 13.6% |
| Sub-Saharan Africans | 0.5 /100 | #254 | Tragic 13.7% |
| Spaniards | 0.4 /100 | #255 | Tragic 13.7% |
| Immigrants | Belize | 0.4 /100 | #256 | Tragic 13.7% |
| Immigrants | Central America | 0.3 /100 | #257 | Tragic 13.8% |
| Immigrants | Guatemala | 0.3 /100 | #258 | Tragic 13.8% |
| Guatemalans | 0.3 /100 | #259 | Tragic 13.8% |
| Swiss | 0.3 /100 | #260 | Tragic 13.8% |
| Hungarians | 0.3 /100 | #261 | Tragic 13.8% |
| Fijians | 0.3 /100 | #262 | Tragic 13.8% |
| Cape Verdeans | 0.2 /100 | #263 | Tragic 13.8% |
| West Indians | 0.2 /100 | #264 | Tragic 13.8% |