Celtic vs Immigrants from Central America Unemployment Among Ages 35 to 44 years
COMPARE
Celtic
Immigrants from Central America
Unemployment Among Ages 35 to 44 years
Unemployment Among Ages 35 to 44 years Comparison
Celtics
Immigrants from Central America
4.7%
UNEMPLOYMENT AMONG AGES 35 TO 44 YEARS
61.7/ 100
METRIC RATING
161st/ 347
METRIC RANK
5.3%
UNEMPLOYMENT AMONG AGES 35 TO 44 YEARS
0.1/ 100
METRIC RATING
262nd/ 347
METRIC RANK
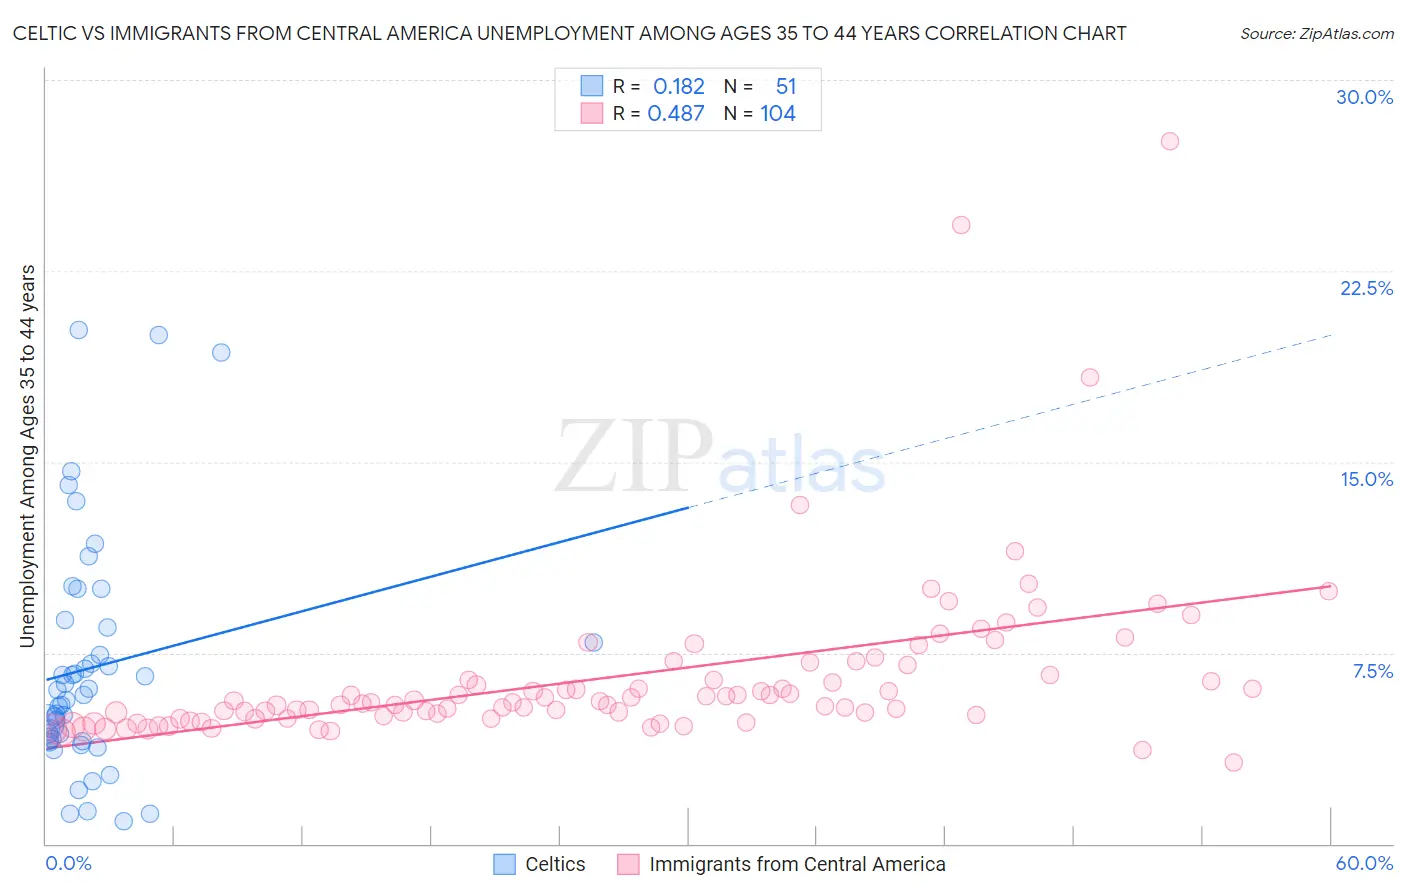
Celtic vs Immigrants from Central America Unemployment Among Ages 35 to 44 years Correlation Chart
The statistical analysis conducted on geographies consisting of 166,324,204 people shows a poor positive correlation between the proportion of Celtics and unemployment rate among population between the ages 35 and 44 in the United States with a correlation coefficient (R) of 0.182 and weighted average of 4.7%. Similarly, the statistical analysis conducted on geographies consisting of 509,941,869 people shows a moderate positive correlation between the proportion of Immigrants from Central America and unemployment rate among population between the ages 35 and 44 in the United States with a correlation coefficient (R) of 0.487 and weighted average of 5.3%, a difference of 14.1%.
Unemployment Among Ages 35 to 44 years Correlation Summary
| Measurement | Celtic | Immigrants from Central America |
| Minimum | 0.90% | 3.2% |
| Maximum | 20.2% | 27.6% |
| Range | 19.3% | 24.4% |
| Mean | 6.9% | 6.5% |
| Median | 5.9% | 5.6% |
| Interquartile 25% (IQ1) | 4.1% | 5.0% |
| Interquartile 75% (IQ3) | 8.5% | 6.5% |
| Interquartile Range (IQR) | 4.4% | 1.5% |
| Standard Deviation (Sample) | 4.6% | 3.4% |
| Standard Deviation (Population) | 4.5% | 3.4% |
Similar Demographics by Unemployment Among Ages 35 to 44 years
Demographics Similar to Celtics by Unemployment Among Ages 35 to 44 years
In terms of unemployment among ages 35 to 44 years, the demographic groups most similar to Celtics are Hungarian (4.6%, a difference of 0.070%), Albanian (4.6%, a difference of 0.10%), Immigrants from Iran (4.6%, a difference of 0.11%), Immigrants from Belarus (4.6%, a difference of 0.14%), and South American (4.6%, a difference of 0.15%).
| Demographics | Rating | Rank | Unemployment Among Ages 35 to 44 years |
| Immigrants | Western Europe | 65.5 /100 | #154 | Good 4.6% |
| Whites/Caucasians | 64.9 /100 | #155 | Good 4.6% |
| South Americans | 63.7 /100 | #156 | Good 4.6% |
| Immigrants | Belarus | 63.4 /100 | #157 | Good 4.6% |
| Immigrants | Iran | 63.1 /100 | #158 | Good 4.6% |
| Albanians | 63.0 /100 | #159 | Good 4.6% |
| Hungarians | 62.6 /100 | #160 | Good 4.6% |
| Celtics | 61.7 /100 | #161 | Good 4.7% |
| Costa Ricans | 59.6 /100 | #162 | Average 4.7% |
| South Africans | 58.5 /100 | #163 | Average 4.7% |
| Immigrants | Morocco | 57.2 /100 | #164 | Average 4.7% |
| German Russians | 57.2 /100 | #165 | Average 4.7% |
| French | 55.6 /100 | #166 | Average 4.7% |
| Peruvians | 54.4 /100 | #167 | Average 4.7% |
| Arabs | 53.1 /100 | #168 | Average 4.7% |
Demographics Similar to Immigrants from Central America by Unemployment Among Ages 35 to 44 years
In terms of unemployment among ages 35 to 44 years, the demographic groups most similar to Immigrants from Central America are Choctaw (5.3%, a difference of 0.070%), Ghanaian (5.3%, a difference of 0.070%), Yaqui (5.3%, a difference of 0.27%), Immigrants from Bangladesh (5.3%, a difference of 0.28%), and Immigrants from Western Africa (5.3%, a difference of 0.41%).
| Demographics | Rating | Rank | Unemployment Among Ages 35 to 44 years |
| Cherokee | 0.2 /100 | #255 | Tragic 5.2% |
| Seminole | 0.1 /100 | #256 | Tragic 5.2% |
| Immigrants | Fiji | 0.1 /100 | #257 | Tragic 5.3% |
| Immigrants | Latin America | 0.1 /100 | #258 | Tragic 5.3% |
| Mexicans | 0.1 /100 | #259 | Tragic 5.3% |
| Sub-Saharan Africans | 0.1 /100 | #260 | Tragic 5.3% |
| Spanish Americans | 0.1 /100 | #261 | Tragic 5.3% |
| Immigrants | Central America | 0.1 /100 | #262 | Tragic 5.3% |
| Choctaw | 0.1 /100 | #263 | Tragic 5.3% |
| Ghanaians | 0.1 /100 | #264 | Tragic 5.3% |
| Yaqui | 0.1 /100 | #265 | Tragic 5.3% |
| Immigrants | Bangladesh | 0.1 /100 | #266 | Tragic 5.3% |
| Immigrants | Western Africa | 0.0 /100 | #267 | Tragic 5.3% |
| Hawaiians | 0.0 /100 | #268 | Tragic 5.3% |
| Cajuns | 0.0 /100 | #269 | Tragic 5.3% |