Celtic vs Scandinavian Single Male Poverty
COMPARE
Celtic
Scandinavian
Single Male Poverty
Single Male Poverty Comparison
Celtics
Scandinavians
14.5%
SINGLE MALE POVERTY
0.0/ 100
METRIC RATING
286th/ 347
METRIC RANK
13.1%
SINGLE MALE POVERTY
12.9/ 100
METRIC RATING
218th/ 347
METRIC RANK
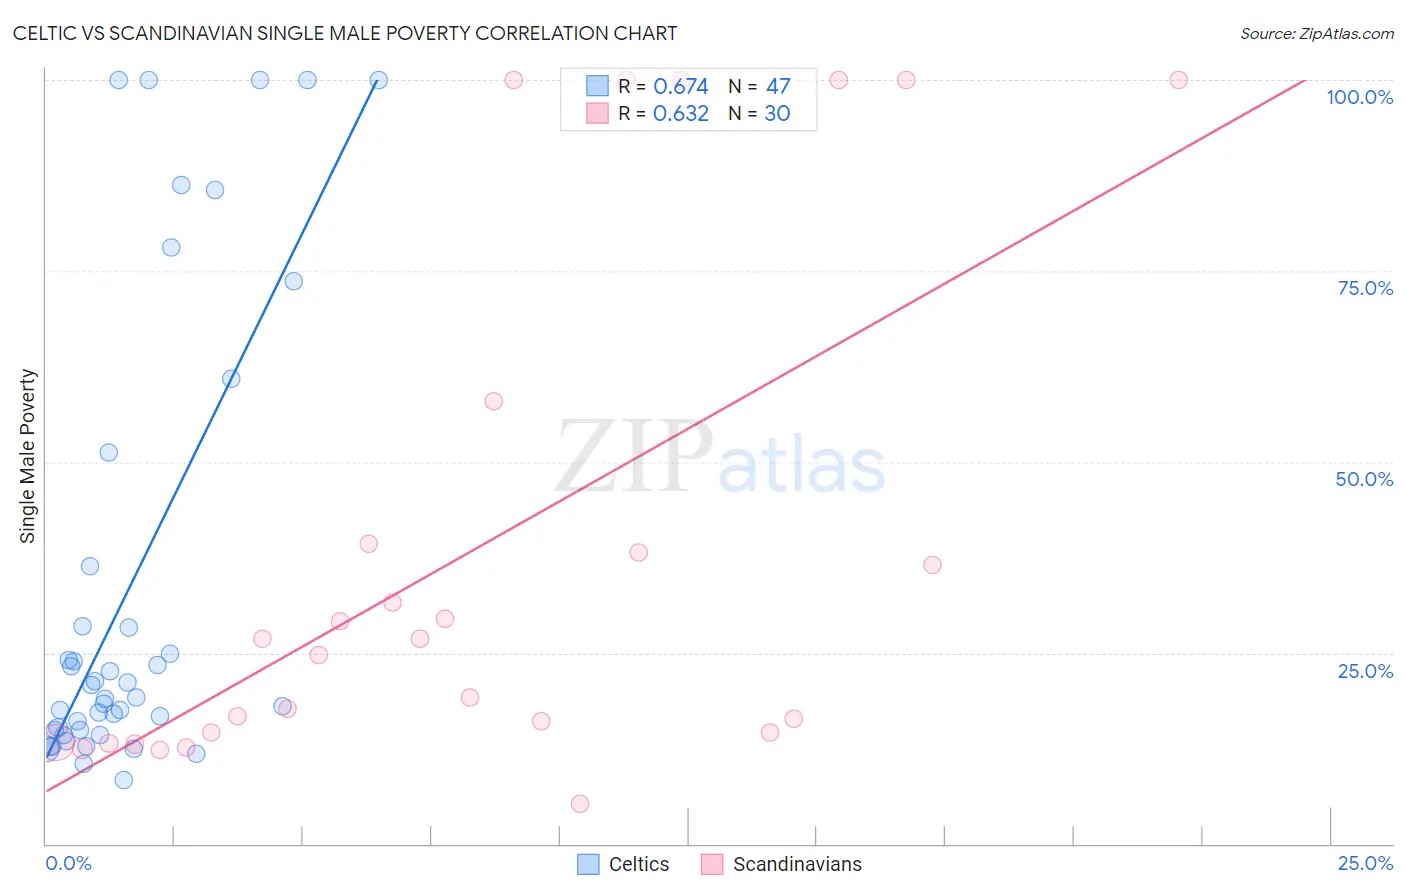
Celtic vs Scandinavian Single Male Poverty Correlation Chart
The statistical analysis conducted on geographies consisting of 157,117,336 people shows a significant positive correlation between the proportion of Celtics and poverty level among single males in the United States with a correlation coefficient (R) of 0.674 and weighted average of 14.5%. Similarly, the statistical analysis conducted on geographies consisting of 403,484,518 people shows a significant positive correlation between the proportion of Scandinavians and poverty level among single males in the United States with a correlation coefficient (R) of 0.632 and weighted average of 13.1%, a difference of 10.3%.
Single Male Poverty Correlation Summary
| Measurement | Celtic | Scandinavian |
| Minimum | 8.3% | 5.2% |
| Maximum | 100.0% | 100.0% |
| Range | 91.7% | 94.8% |
| Mean | 33.9% | 37.9% |
| Median | 19.2% | 25.7% |
| Interquartile 25% (IQ1) | 14.9% | 14.5% |
| Interquartile 75% (IQ3) | 36.4% | 39.3% |
| Interquartile Range (IQR) | 21.5% | 24.8% |
| Standard Deviation (Sample) | 30.2% | 33.3% |
| Standard Deviation (Population) | 29.8% | 32.8% |
Similar Demographics by Single Male Poverty
Demographics Similar to Celtics by Single Male Poverty
In terms of single male poverty, the demographic groups most similar to Celtics are Iroquois (14.5%, a difference of 0.13%), White/Caucasian (14.5%, a difference of 0.13%), Immigrants from Dominica (14.5%, a difference of 0.22%), French (14.4%, a difference of 0.32%), and U.S. Virgin Islander (14.5%, a difference of 0.44%).
| Demographics | Rating | Rank | Single Male Poverty |
| Indonesians | 0.0 /100 | #279 | Tragic 14.1% |
| Hmong | 0.0 /100 | #280 | Tragic 14.2% |
| Hispanics or Latinos | 0.0 /100 | #281 | Tragic 14.2% |
| Spanish Americans | 0.0 /100 | #282 | Tragic 14.2% |
| Yaqui | 0.0 /100 | #283 | Tragic 14.2% |
| Immigrants | Bahamas | 0.0 /100 | #284 | Tragic 14.4% |
| French | 0.0 /100 | #285 | Tragic 14.4% |
| Celtics | 0.0 /100 | #286 | Tragic 14.5% |
| Iroquois | 0.0 /100 | #287 | Tragic 14.5% |
| Whites/Caucasians | 0.0 /100 | #288 | Tragic 14.5% |
| Immigrants | Dominica | 0.0 /100 | #289 | Tragic 14.5% |
| U.S. Virgin Islanders | 0.0 /100 | #290 | Tragic 14.5% |
| Bahamians | 0.0 /100 | #291 | Tragic 14.6% |
| Immigrants | Nonimmigrants | 0.0 /100 | #292 | Tragic 14.6% |
| French Canadians | 0.0 /100 | #293 | Tragic 14.6% |
Demographics Similar to Scandinavians by Single Male Poverty
In terms of single male poverty, the demographic groups most similar to Scandinavians are Bermudan (13.1%, a difference of 0.020%), Immigrants from Burma/Myanmar (13.1%, a difference of 0.030%), Austrian (13.1%, a difference of 0.11%), Japanese (13.1%, a difference of 0.21%), and Zimbabwean (13.1%, a difference of 0.22%).
| Demographics | Rating | Rank | Single Male Poverty |
| Swedes | 16.8 /100 | #211 | Poor 13.1% |
| Senegalese | 16.4 /100 | #212 | Poor 13.1% |
| Italians | 15.9 /100 | #213 | Poor 13.1% |
| Zimbabweans | 14.9 /100 | #214 | Poor 13.1% |
| Japanese | 14.8 /100 | #215 | Poor 13.1% |
| Austrians | 13.9 /100 | #216 | Poor 13.1% |
| Bermudans | 13.0 /100 | #217 | Poor 13.1% |
| Scandinavians | 12.9 /100 | #218 | Poor 13.1% |
| Immigrants | Burma/Myanmar | 12.6 /100 | #219 | Poor 13.1% |
| Central Americans | 10.9 /100 | #220 | Poor 13.2% |
| New Zealanders | 10.7 /100 | #221 | Poor 13.2% |
| Immigrants | Western Europe | 10.0 /100 | #222 | Poor 13.2% |
| Immigrants | Azores | 9.3 /100 | #223 | Tragic 13.2% |
| Somalis | 9.1 /100 | #224 | Tragic 13.2% |
| Immigrants | Denmark | 8.7 /100 | #225 | Tragic 13.2% |