Celtic vs Immigrants from Congo Single Male Poverty
COMPARE
Celtic
Immigrants from Congo
Single Male Poverty
Single Male Poverty Comparison
Celtics
Immigrants from Congo
14.5%
SINGLE MALE POVERTY
0.0/ 100
METRIC RATING
286th/ 347
METRIC RANK
13.9%
SINGLE MALE POVERTY
0.2/ 100
METRIC RATING
265th/ 347
METRIC RANK
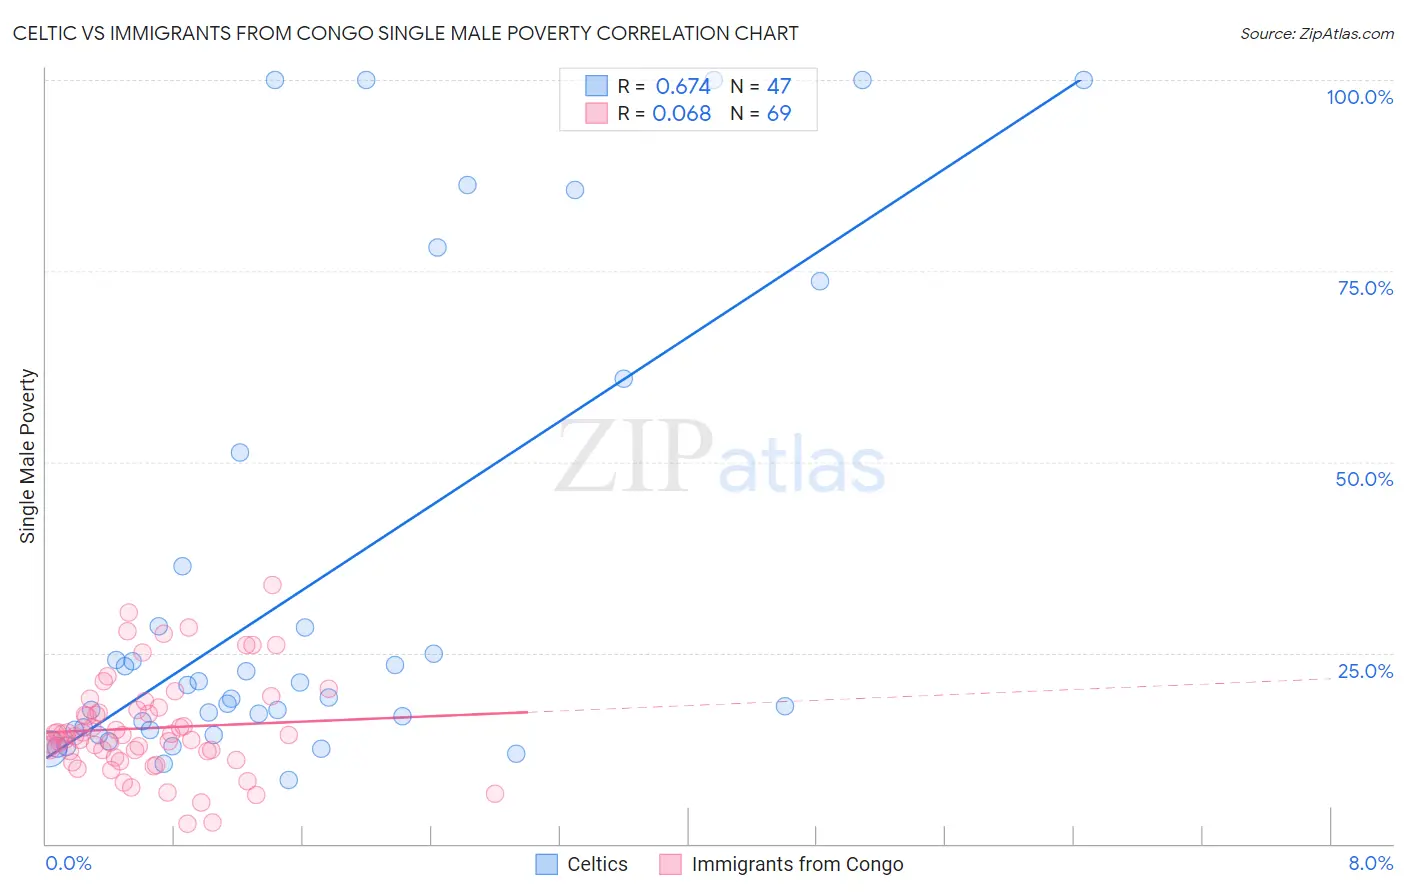
Celtic vs Immigrants from Congo Single Male Poverty Correlation Chart
The statistical analysis conducted on geographies consisting of 157,117,336 people shows a significant positive correlation between the proportion of Celtics and poverty level among single males in the United States with a correlation coefficient (R) of 0.674 and weighted average of 14.5%. Similarly, the statistical analysis conducted on geographies consisting of 89,882,140 people shows a slight positive correlation between the proportion of Immigrants from Congo and poverty level among single males in the United States with a correlation coefficient (R) of 0.068 and weighted average of 13.9%, a difference of 4.3%.
Single Male Poverty Correlation Summary
| Measurement | Celtic | Immigrants from Congo |
| Minimum | 8.3% | 2.6% |
| Maximum | 100.0% | 33.9% |
| Range | 91.7% | 31.2% |
| Mean | 33.9% | 15.1% |
| Median | 19.2% | 14.3% |
| Interquartile 25% (IQ1) | 14.9% | 11.7% |
| Interquartile 75% (IQ3) | 36.4% | 17.7% |
| Interquartile Range (IQR) | 21.5% | 6.0% |
| Standard Deviation (Sample) | 30.2% | 6.4% |
| Standard Deviation (Population) | 29.8% | 6.4% |
Similar Demographics by Single Male Poverty
Demographics Similar to Celtics by Single Male Poverty
In terms of single male poverty, the demographic groups most similar to Celtics are Iroquois (14.5%, a difference of 0.13%), White/Caucasian (14.5%, a difference of 0.13%), Immigrants from Dominica (14.5%, a difference of 0.22%), French (14.4%, a difference of 0.32%), and U.S. Virgin Islander (14.5%, a difference of 0.44%).
| Demographics | Rating | Rank | Single Male Poverty |
| Indonesians | 0.0 /100 | #279 | Tragic 14.1% |
| Hmong | 0.0 /100 | #280 | Tragic 14.2% |
| Hispanics or Latinos | 0.0 /100 | #281 | Tragic 14.2% |
| Spanish Americans | 0.0 /100 | #282 | Tragic 14.2% |
| Yaqui | 0.0 /100 | #283 | Tragic 14.2% |
| Immigrants | Bahamas | 0.0 /100 | #284 | Tragic 14.4% |
| French | 0.0 /100 | #285 | Tragic 14.4% |
| Celtics | 0.0 /100 | #286 | Tragic 14.5% |
| Iroquois | 0.0 /100 | #287 | Tragic 14.5% |
| Whites/Caucasians | 0.0 /100 | #288 | Tragic 14.5% |
| Immigrants | Dominica | 0.0 /100 | #289 | Tragic 14.5% |
| U.S. Virgin Islanders | 0.0 /100 | #290 | Tragic 14.5% |
| Bahamians | 0.0 /100 | #291 | Tragic 14.6% |
| Immigrants | Nonimmigrants | 0.0 /100 | #292 | Tragic 14.6% |
| French Canadians | 0.0 /100 | #293 | Tragic 14.6% |
Demographics Similar to Immigrants from Congo by Single Male Poverty
In terms of single male poverty, the demographic groups most similar to Immigrants from Congo are West Indian (13.8%, a difference of 0.16%), Immigrants from Cabo Verde (13.9%, a difference of 0.31%), Cape Verdean (13.8%, a difference of 0.35%), Fijian (13.8%, a difference of 0.47%), and German (13.9%, a difference of 0.47%).
| Demographics | Rating | Rank | Single Male Poverty |
| Immigrants | Guatemala | 0.3 /100 | #258 | Tragic 13.8% |
| Guatemalans | 0.3 /100 | #259 | Tragic 13.8% |
| Swiss | 0.3 /100 | #260 | Tragic 13.8% |
| Hungarians | 0.3 /100 | #261 | Tragic 13.8% |
| Fijians | 0.3 /100 | #262 | Tragic 13.8% |
| Cape Verdeans | 0.2 /100 | #263 | Tragic 13.8% |
| West Indians | 0.2 /100 | #264 | Tragic 13.8% |
| Immigrants | Congo | 0.2 /100 | #265 | Tragic 13.9% |
| Immigrants | Cabo Verde | 0.1 /100 | #266 | Tragic 13.9% |
| Germans | 0.1 /100 | #267 | Tragic 13.9% |
| Immigrants | Mexico | 0.1 /100 | #268 | Tragic 13.9% |
| Scottish | 0.1 /100 | #269 | Tragic 14.0% |
| Immigrants | Saudi Arabia | 0.1 /100 | #270 | Tragic 14.0% |
| Irish | 0.1 /100 | #271 | Tragic 14.0% |
| Mexicans | 0.1 /100 | #272 | Tragic 14.0% |