Asian vs Immigrants from India Single Female Poverty
COMPARE
Asian
Immigrants from India
Single Female Poverty
Single Female Poverty Comparison
Asians
Immigrants from India
18.3%
SINGLE FEMALE POVERTY
100.0/ 100
METRIC RATING
23rd/ 347
METRIC RANK
16.8%
SINGLE FEMALE POVERTY
100.0/ 100
METRIC RATING
4th/ 347
METRIC RANK
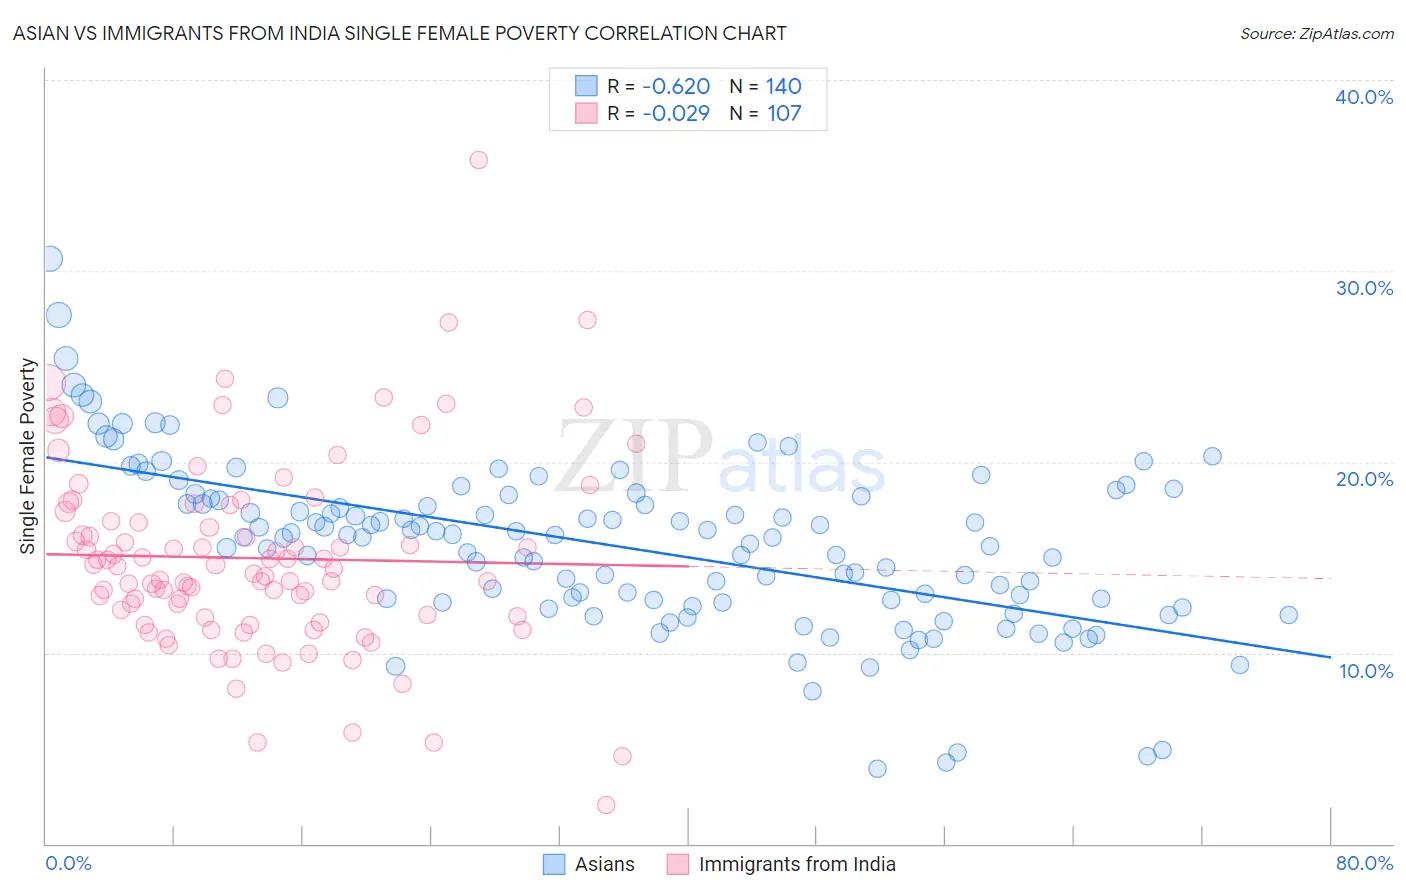
Asian vs Immigrants from India Single Female Poverty Correlation Chart
The statistical analysis conducted on geographies consisting of 534,134,882 people shows a significant negative correlation between the proportion of Asians and poverty level among single females in the United States with a correlation coefficient (R) of -0.620 and weighted average of 18.3%. Similarly, the statistical analysis conducted on geographies consisting of 425,520,068 people shows no correlation between the proportion of Immigrants from India and poverty level among single females in the United States with a correlation coefficient (R) of -0.029 and weighted average of 16.8%, a difference of 8.7%.
Single Female Poverty Correlation Summary
| Measurement | Asian | Immigrants from India |
| Minimum | 3.9% | 2.0% |
| Maximum | 30.6% | 35.8% |
| Range | 26.7% | 33.8% |
| Mean | 15.6% | 15.0% |
| Median | 16.0% | 14.4% |
| Interquartile 25% (IQ1) | 12.7% | 11.9% |
| Interquartile 75% (IQ3) | 18.1% | 17.4% |
| Interquartile Range (IQR) | 5.4% | 5.5% |
| Standard Deviation (Sample) | 4.4% | 5.1% |
| Standard Deviation (Population) | 4.4% | 5.0% |
Demographics Similar to Asians and Immigrants from India by Single Female Poverty
In terms of single female poverty, the demographic groups most similar to Asians are Burmese (18.3%, a difference of 0.0%), Maltese (18.3%, a difference of 0.020%), Immigrants from Greece (18.3%, a difference of 0.070%), Immigrants from China (18.1%, a difference of 0.76%), and Immigrants from Eastern Asia (18.1%, a difference of 0.79%). Similarly, the demographic groups most similar to Immigrants from India are Assyrian/Chaldean/Syriac (17.0%, a difference of 0.83%), Filipino (17.0%, a difference of 1.0%), Immigrants from Hong Kong (16.5%, a difference of 1.7%), Thai (17.3%, a difference of 2.8%), and Immigrants from Iran (17.5%, a difference of 3.8%).
| Demographics | Rating | Rank | Single Female Poverty |
| Immigrants | Hong Kong | 100.0 /100 | #3 | Exceptional 16.5% |
| Immigrants | India | 100.0 /100 | #4 | Exceptional 16.8% |
| Assyrians/Chaldeans/Syriacs | 100.0 /100 | #5 | Exceptional 17.0% |
| Filipinos | 100.0 /100 | #6 | Exceptional 17.0% |
| Thais | 100.0 /100 | #7 | Exceptional 17.3% |
| Immigrants | Iran | 100.0 /100 | #8 | Exceptional 17.5% |
| Bhutanese | 100.0 /100 | #9 | Exceptional 17.7% |
| Immigrants | Ireland | 100.0 /100 | #10 | Exceptional 17.8% |
| Immigrants | Lithuania | 100.0 /100 | #11 | Exceptional 17.8% |
| Immigrants | South Central Asia | 100.0 /100 | #12 | Exceptional 17.8% |
| Immigrants | Bolivia | 100.0 /100 | #13 | Exceptional 17.8% |
| Bolivians | 100.0 /100 | #14 | Exceptional 17.9% |
| Indians (Asian) | 100.0 /100 | #15 | Exceptional 17.9% |
| Iranians | 100.0 /100 | #16 | Exceptional 18.0% |
| Immigrants | Korea | 100.0 /100 | #17 | Exceptional 18.1% |
| Immigrants | Eastern Asia | 100.0 /100 | #18 | Exceptional 18.1% |
| Immigrants | China | 100.0 /100 | #19 | Exceptional 18.1% |
| Immigrants | Greece | 100.0 /100 | #20 | Exceptional 18.3% |
| Maltese | 100.0 /100 | #21 | Exceptional 18.3% |
| Burmese | 100.0 /100 | #22 | Exceptional 18.3% |
| Asians | 100.0 /100 | #23 | Exceptional 18.3% |