Asian vs Moroccan 11th Grade
COMPARE
Asian
Moroccan
11th Grade
11th Grade Comparison
Asians
Moroccans
92.5%
11TH GRADE
50.0/ 100
METRIC RATING
174th/ 347
METRIC RANK
92.3%
11TH GRADE
28.7/ 100
METRIC RATING
193rd/ 347
METRIC RANK
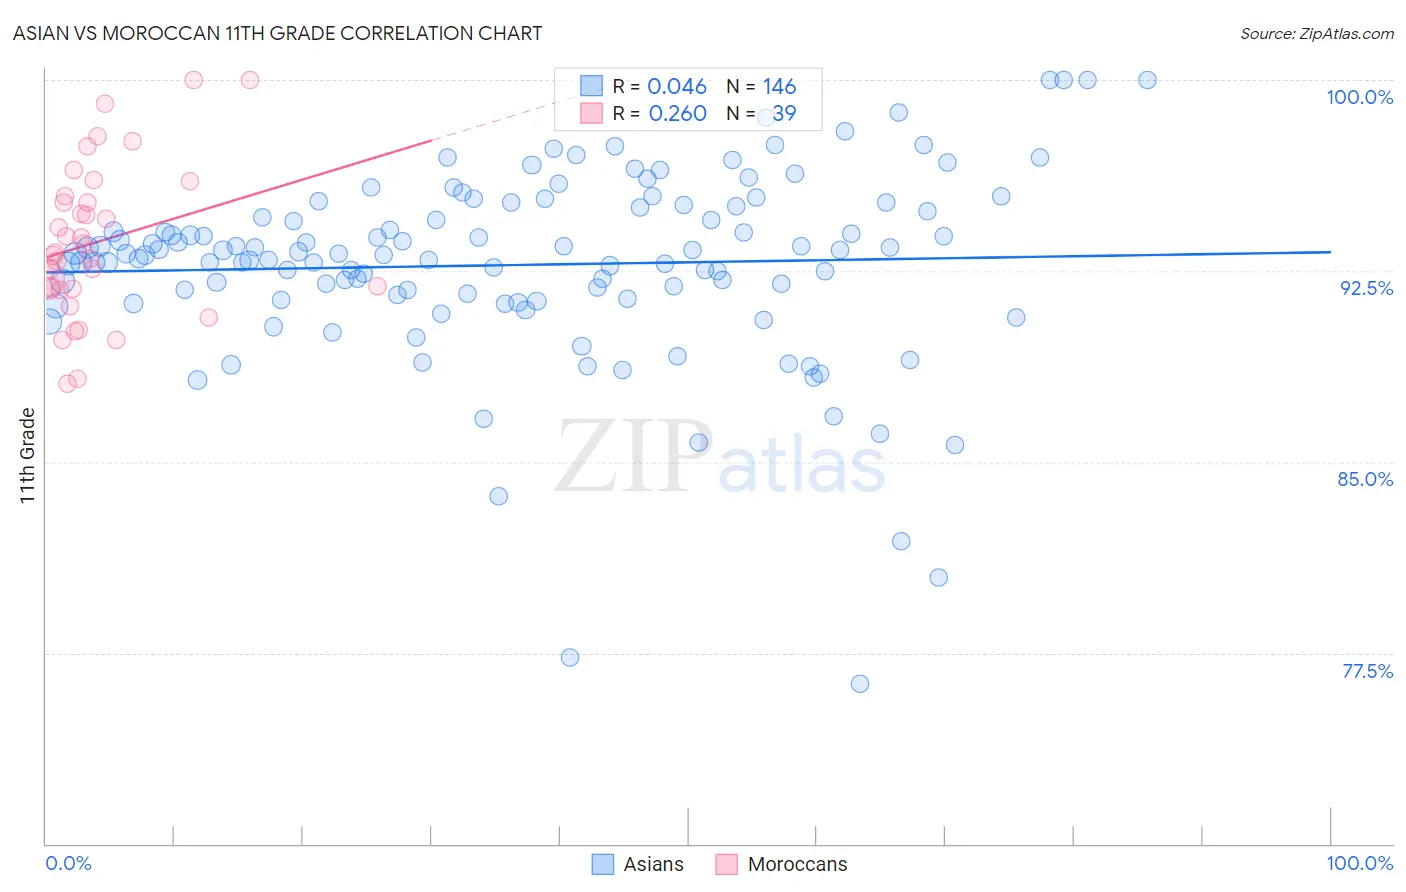
Asian vs Moroccan 11th Grade Correlation Chart
The statistical analysis conducted on geographies consisting of 550,778,127 people shows no correlation between the proportion of Asians and percentage of population with at least 11th grade education in the United States with a correlation coefficient (R) of 0.046 and weighted average of 92.5%. Similarly, the statistical analysis conducted on geographies consisting of 201,817,667 people shows a weak positive correlation between the proportion of Moroccans and percentage of population with at least 11th grade education in the United States with a correlation coefficient (R) of 0.260 and weighted average of 92.3%, a difference of 0.22%.
11th Grade Correlation Summary
| Measurement | Asian | Moroccan |
| Minimum | 76.3% | 88.1% |
| Maximum | 100.0% | 100.0% |
| Range | 23.7% | 11.9% |
| Mean | 92.7% | 93.6% |
| Median | 93.2% | 93.2% |
| Interquartile 25% (IQ1) | 91.4% | 91.8% |
| Interquartile 75% (IQ3) | 95.0% | 95.4% |
| Interquartile Range (IQR) | 3.6% | 3.6% |
| Standard Deviation (Sample) | 3.8% | 3.0% |
| Standard Deviation (Population) | 3.7% | 3.0% |
Demographics Similar to Asians and Moroccans by 11th Grade
In terms of 11th grade, the demographic groups most similar to Asians are Shoshone (92.5%, a difference of 0.010%), Indian (Asian) (92.5%, a difference of 0.020%), Spaniard (92.5%, a difference of 0.030%), Guamanian/Chamorro (92.5%, a difference of 0.050%), and Sudanese (92.5%, a difference of 0.070%). Similarly, the demographic groups most similar to Moroccans are French American Indian (92.3%, a difference of 0.020%), Immigrants from Syria (92.3%, a difference of 0.020%), Chickasaw (92.3%, a difference of 0.030%), Immigrants from Chile (92.4%, a difference of 0.050%), and Immigrants from Indonesia (92.4%, a difference of 0.060%).
| Demographics | Rating | Rank | 11th Grade |
| Indians (Asian) | 51.5 /100 | #173 | Average 92.5% |
| Asians | 50.0 /100 | #174 | Average 92.5% |
| Shoshone | 48.9 /100 | #175 | Average 92.5% |
| Spaniards | 46.9 /100 | #176 | Average 92.5% |
| Guamanians/Chamorros | 45.0 /100 | #177 | Average 92.5% |
| Sudanese | 43.4 /100 | #178 | Average 92.5% |
| Creek | 40.9 /100 | #179 | Average 92.4% |
| Inupiat | 40.7 /100 | #180 | Average 92.4% |
| Cherokee | 40.7 /100 | #181 | Average 92.4% |
| Immigrants | Morocco | 38.6 /100 | #182 | Fair 92.4% |
| Immigrants | Malaysia | 37.6 /100 | #183 | Fair 92.4% |
| Immigrants | Asia | 37.4 /100 | #184 | Fair 92.4% |
| Immigrants | Nepal | 36.4 /100 | #185 | Fair 92.4% |
| Arapaho | 35.1 /100 | #186 | Fair 92.4% |
| Immigrants | Western Asia | 35.0 /100 | #187 | Fair 92.4% |
| Immigrants | Indonesia | 33.7 /100 | #188 | Fair 92.4% |
| Immigrants | Chile | 33.3 /100 | #189 | Fair 92.4% |
| Chickasaw | 31.4 /100 | #190 | Fair 92.3% |
| French American Indians | 30.8 /100 | #191 | Fair 92.3% |
| Immigrants | Syria | 30.4 /100 | #192 | Fair 92.3% |
| Moroccans | 28.7 /100 | #193 | Fair 92.3% |