Asian vs Immigrants from Zimbabwe Single Female Poverty
COMPARE
Asian
Immigrants from Zimbabwe
Single Female Poverty
Single Female Poverty Comparison
Asians
Immigrants from Zimbabwe
18.3%
SINGLE FEMALE POVERTY
100.0/ 100
METRIC RATING
23rd/ 347
METRIC RANK
20.0%
SINGLE FEMALE POVERTY
95.9/ 100
METRIC RATING
113th/ 347
METRIC RANK
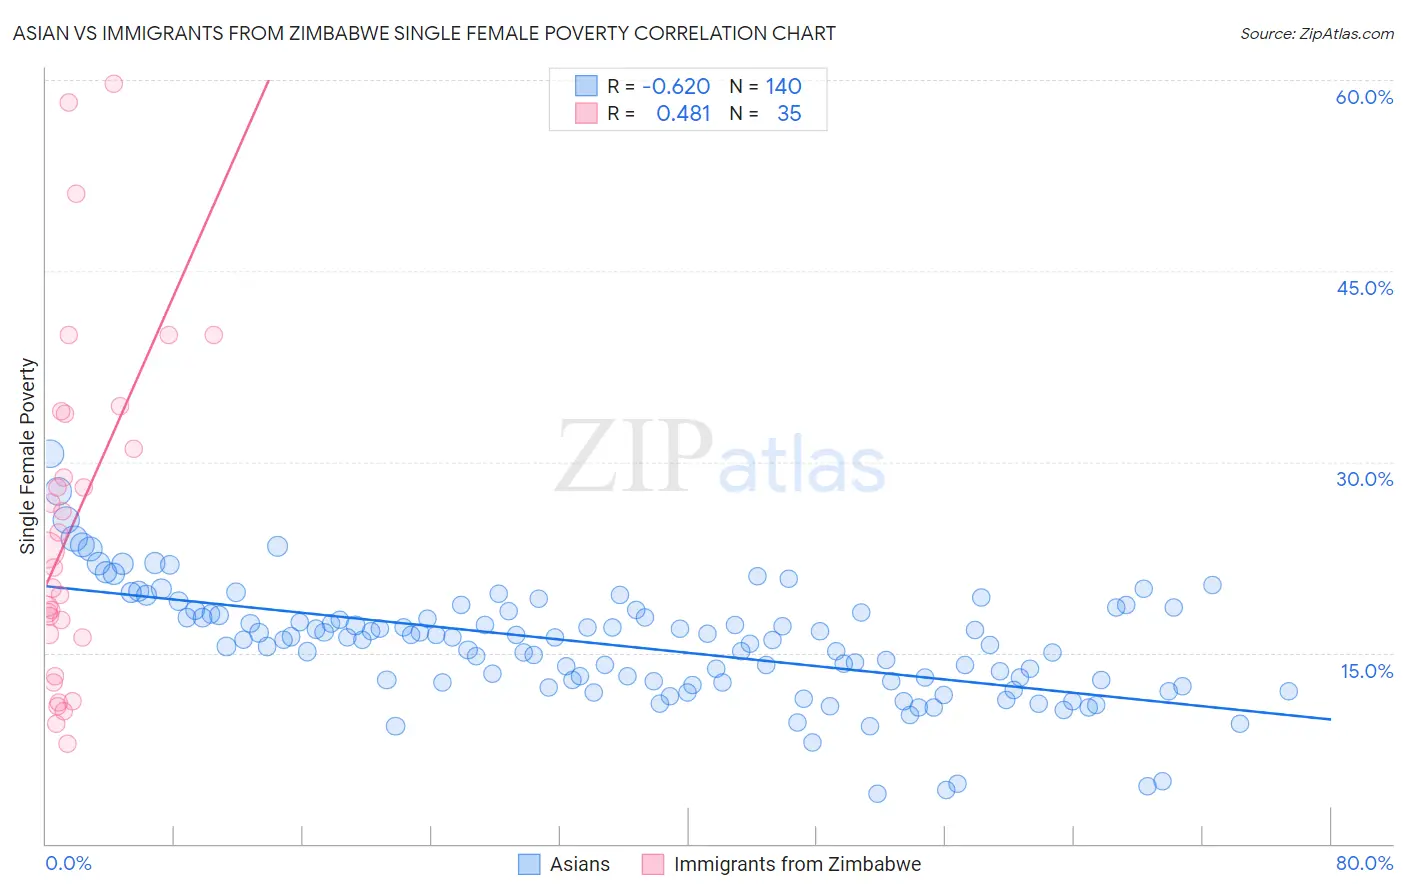
Asian vs Immigrants from Zimbabwe Single Female Poverty Correlation Chart
The statistical analysis conducted on geographies consisting of 534,134,882 people shows a significant negative correlation between the proportion of Asians and poverty level among single females in the United States with a correlation coefficient (R) of -0.620 and weighted average of 18.3%. Similarly, the statistical analysis conducted on geographies consisting of 117,320,666 people shows a moderate positive correlation between the proportion of Immigrants from Zimbabwe and poverty level among single females in the United States with a correlation coefficient (R) of 0.481 and weighted average of 20.0%, a difference of 9.3%.
Single Female Poverty Correlation Summary
| Measurement | Asian | Immigrants from Zimbabwe |
| Minimum | 3.9% | 7.9% |
| Maximum | 30.6% | 59.7% |
| Range | 26.7% | 51.9% |
| Mean | 15.6% | 25.1% |
| Median | 16.0% | 21.7% |
| Interquartile 25% (IQ1) | 12.7% | 16.2% |
| Interquartile 75% (IQ3) | 18.1% | 33.7% |
| Interquartile Range (IQR) | 5.4% | 17.6% |
| Standard Deviation (Sample) | 4.4% | 13.4% |
| Standard Deviation (Population) | 4.4% | 13.2% |
Similar Demographics by Single Female Poverty
Demographics Similar to Asians by Single Female Poverty
In terms of single female poverty, the demographic groups most similar to Asians are Burmese (18.3%, a difference of 0.0%), Maltese (18.3%, a difference of 0.020%), Immigrants from Greece (18.3%, a difference of 0.070%), Armenian (18.3%, a difference of 0.23%), and Immigrants from Singapore (18.3%, a difference of 0.33%).
| Demographics | Rating | Rank | Single Female Poverty |
| Iranians | 100.0 /100 | #16 | Exceptional 18.0% |
| Immigrants | Korea | 100.0 /100 | #17 | Exceptional 18.1% |
| Immigrants | Eastern Asia | 100.0 /100 | #18 | Exceptional 18.1% |
| Immigrants | China | 100.0 /100 | #19 | Exceptional 18.1% |
| Immigrants | Greece | 100.0 /100 | #20 | Exceptional 18.3% |
| Maltese | 100.0 /100 | #21 | Exceptional 18.3% |
| Burmese | 100.0 /100 | #22 | Exceptional 18.3% |
| Asians | 100.0 /100 | #23 | Exceptional 18.3% |
| Armenians | 100.0 /100 | #24 | Exceptional 18.3% |
| Immigrants | Singapore | 100.0 /100 | #25 | Exceptional 18.3% |
| Immigrants | Israel | 100.0 /100 | #26 | Exceptional 18.3% |
| Immigrants | Pakistan | 100.0 /100 | #27 | Exceptional 18.4% |
| Immigrants | Moldova | 100.0 /100 | #28 | Exceptional 18.5% |
| Immigrants | Poland | 100.0 /100 | #29 | Exceptional 18.5% |
| Immigrants | North Macedonia | 99.9 /100 | #30 | Exceptional 18.5% |
Demographics Similar to Immigrants from Zimbabwe by Single Female Poverty
In terms of single female poverty, the demographic groups most similar to Immigrants from Zimbabwe are Immigrants from Colombia (20.0%, a difference of 0.0%), Immigrants from Northern Africa (20.0%, a difference of 0.020%), Immigrants from Netherlands (20.0%, a difference of 0.050%), Immigrants from Kazakhstan (20.0%, a difference of 0.060%), and Polish (20.0%, a difference of 0.10%).
| Demographics | Rating | Rank | Single Female Poverty |
| Ethiopians | 96.7 /100 | #106 | Exceptional 19.9% |
| Immigrants | Syria | 96.7 /100 | #107 | Exceptional 19.9% |
| Native Hawaiians | 96.6 /100 | #108 | Exceptional 19.9% |
| Colombians | 96.6 /100 | #109 | Exceptional 19.9% |
| Immigrants | Western Asia | 96.5 /100 | #110 | Exceptional 19.9% |
| Carpatho Rusyns | 96.1 /100 | #111 | Exceptional 20.0% |
| Immigrants | Netherlands | 96.0 /100 | #112 | Exceptional 20.0% |
| Immigrants | Zimbabwe | 95.9 /100 | #113 | Exceptional 20.0% |
| Immigrants | Colombia | 95.9 /100 | #114 | Exceptional 20.0% |
| Immigrants | Northern Africa | 95.8 /100 | #115 | Exceptional 20.0% |
| Immigrants | Kazakhstan | 95.7 /100 | #116 | Exceptional 20.0% |
| Poles | 95.6 /100 | #117 | Exceptional 20.0% |
| Immigrants | Afghanistan | 95.4 /100 | #118 | Exceptional 20.0% |
| Immigrants | Ethiopia | 95.4 /100 | #119 | Exceptional 20.0% |
| South Americans | 95.1 /100 | #120 | Exceptional 20.0% |