Asian vs Pennsylvania German Single Female Poverty
COMPARE
Asian
Pennsylvania German
Single Female Poverty
Single Female Poverty Comparison
Asians
Pennsylvania Germans
18.3%
SINGLE FEMALE POVERTY
100.0/ 100
METRIC RATING
23rd/ 347
METRIC RANK
23.6%
SINGLE FEMALE POVERTY
0.0/ 100
METRIC RATING
277th/ 347
METRIC RANK
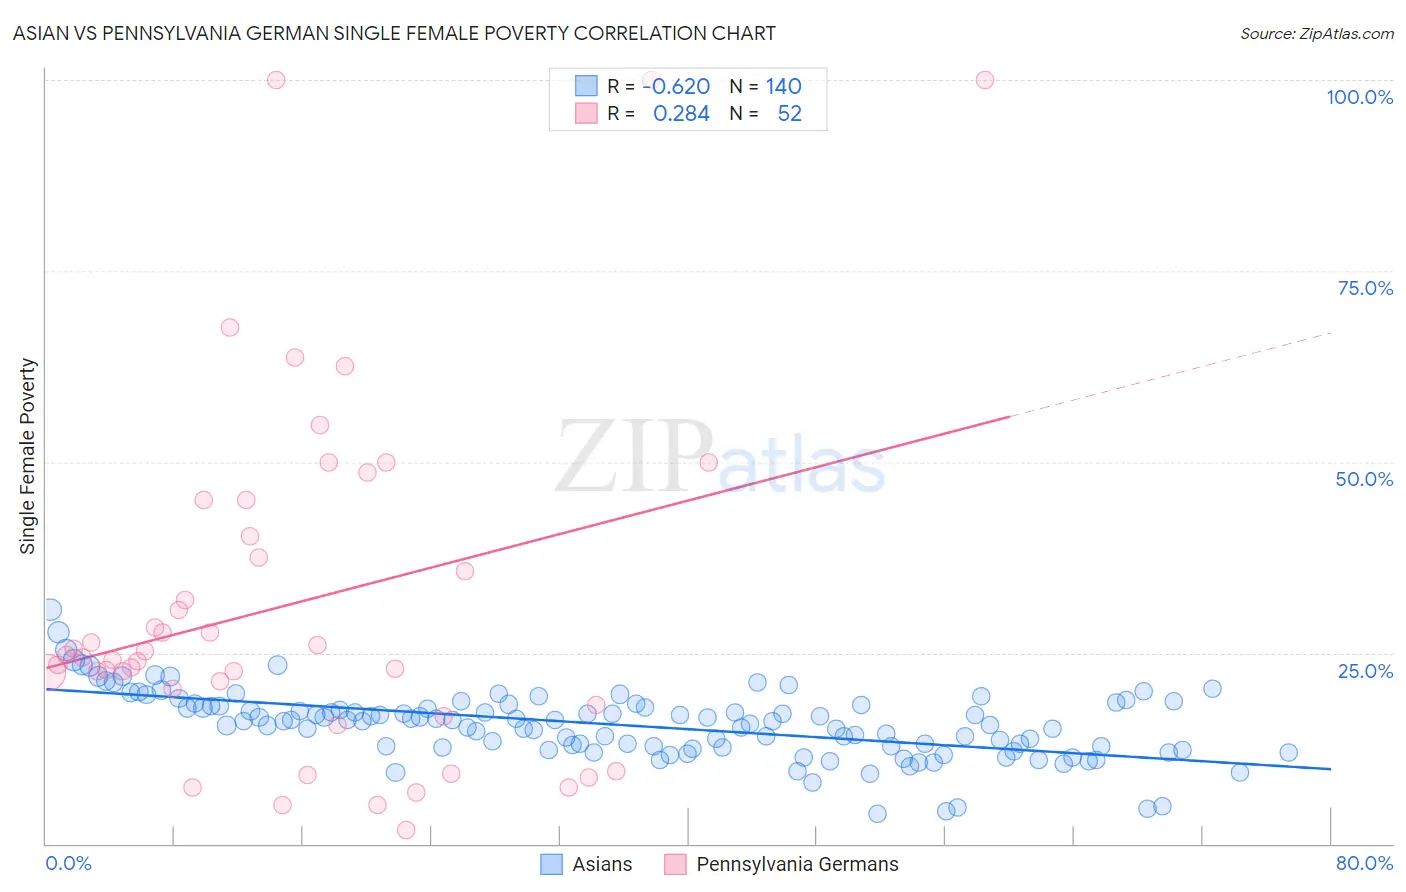
Asian vs Pennsylvania German Single Female Poverty Correlation Chart
The statistical analysis conducted on geographies consisting of 534,134,882 people shows a significant negative correlation between the proportion of Asians and poverty level among single females in the United States with a correlation coefficient (R) of -0.620 and weighted average of 18.3%. Similarly, the statistical analysis conducted on geographies consisting of 231,066,228 people shows a weak positive correlation between the proportion of Pennsylvania Germans and poverty level among single females in the United States with a correlation coefficient (R) of 0.284 and weighted average of 23.6%, a difference of 29.0%.
Single Female Poverty Correlation Summary
| Measurement | Asian | Pennsylvania German |
| Minimum | 3.9% | 1.8% |
| Maximum | 30.6% | 100.0% |
| Range | 26.7% | 98.2% |
| Mean | 15.6% | 31.6% |
| Median | 16.0% | 24.5% |
| Interquartile 25% (IQ1) | 12.7% | 19.2% |
| Interquartile 75% (IQ3) | 18.1% | 42.6% |
| Interquartile Range (IQR) | 5.4% | 23.4% |
| Standard Deviation (Sample) | 4.4% | 23.3% |
| Standard Deviation (Population) | 4.4% | 23.1% |
Similar Demographics by Single Female Poverty
Demographics Similar to Asians by Single Female Poverty
In terms of single female poverty, the demographic groups most similar to Asians are Burmese (18.3%, a difference of 0.0%), Maltese (18.3%, a difference of 0.020%), Immigrants from Greece (18.3%, a difference of 0.070%), Armenian (18.3%, a difference of 0.23%), and Immigrants from Singapore (18.3%, a difference of 0.33%).
| Demographics | Rating | Rank | Single Female Poverty |
| Iranians | 100.0 /100 | #16 | Exceptional 18.0% |
| Immigrants | Korea | 100.0 /100 | #17 | Exceptional 18.1% |
| Immigrants | Eastern Asia | 100.0 /100 | #18 | Exceptional 18.1% |
| Immigrants | China | 100.0 /100 | #19 | Exceptional 18.1% |
| Immigrants | Greece | 100.0 /100 | #20 | Exceptional 18.3% |
| Maltese | 100.0 /100 | #21 | Exceptional 18.3% |
| Burmese | 100.0 /100 | #22 | Exceptional 18.3% |
| Asians | 100.0 /100 | #23 | Exceptional 18.3% |
| Armenians | 100.0 /100 | #24 | Exceptional 18.3% |
| Immigrants | Singapore | 100.0 /100 | #25 | Exceptional 18.3% |
| Immigrants | Israel | 100.0 /100 | #26 | Exceptional 18.3% |
| Immigrants | Pakistan | 100.0 /100 | #27 | Exceptional 18.4% |
| Immigrants | Moldova | 100.0 /100 | #28 | Exceptional 18.5% |
| Immigrants | Poland | 100.0 /100 | #29 | Exceptional 18.5% |
| Immigrants | North Macedonia | 99.9 /100 | #30 | Exceptional 18.5% |
Demographics Similar to Pennsylvania Germans by Single Female Poverty
In terms of single female poverty, the demographic groups most similar to Pennsylvania Germans are Nonimmigrants (23.6%, a difference of 0.080%), Alaskan Athabascan (23.6%, a difference of 0.11%), Immigrants from the Azores (23.5%, a difference of 0.15%), Immigrants from Latin America (23.7%, a difference of 0.60%), and Mexican American Indian (23.4%, a difference of 0.94%).
| Demographics | Rating | Rank | Single Female Poverty |
| Inupiat | 0.2 /100 | #270 | Tragic 23.1% |
| Sub-Saharan Africans | 0.1 /100 | #271 | Tragic 23.2% |
| Immigrants | Senegal | 0.1 /100 | #272 | Tragic 23.2% |
| Alaska Natives | 0.1 /100 | #273 | Tragic 23.3% |
| Marshallese | 0.1 /100 | #274 | Tragic 23.3% |
| Mexican American Indians | 0.1 /100 | #275 | Tragic 23.4% |
| Immigrants | Azores | 0.0 /100 | #276 | Tragic 23.5% |
| Pennsylvania Germans | 0.0 /100 | #277 | Tragic 23.6% |
| Immigrants | Nonimmigrants | 0.0 /100 | #278 | Tragic 23.6% |
| Alaskan Athabascans | 0.0 /100 | #279 | Tragic 23.6% |
| Immigrants | Latin America | 0.0 /100 | #280 | Tragic 23.7% |
| Immigrants | Zaire | 0.0 /100 | #281 | Tragic 23.8% |
| Guatemalans | 0.0 /100 | #282 | Tragic 23.8% |
| German Russians | 0.0 /100 | #283 | Tragic 23.9% |
| Immigrants | Dominica | 0.0 /100 | #284 | Tragic 23.9% |