Asian vs Immigrants from Cameroon Single Female Poverty
COMPARE
Asian
Immigrants from Cameroon
Single Female Poverty
Single Female Poverty Comparison
Asians
Immigrants from Cameroon
18.3%
SINGLE FEMALE POVERTY
100.0/ 100
METRIC RATING
23rd/ 347
METRIC RANK
19.8%
SINGLE FEMALE POVERTY
97.3/ 100
METRIC RATING
102nd/ 347
METRIC RANK
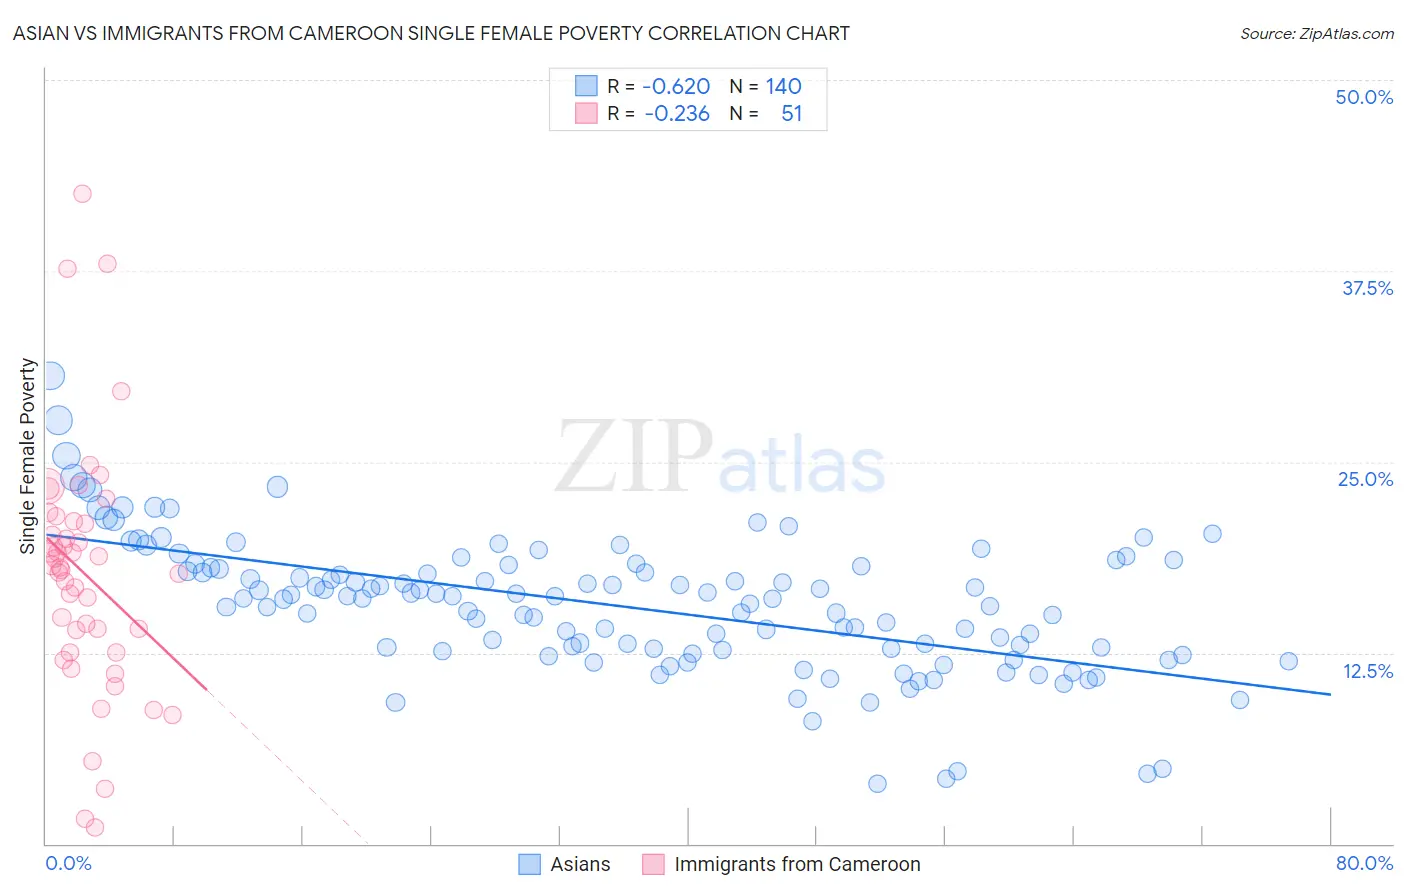
Asian vs Immigrants from Cameroon Single Female Poverty Correlation Chart
The statistical analysis conducted on geographies consisting of 534,134,882 people shows a significant negative correlation between the proportion of Asians and poverty level among single females in the United States with a correlation coefficient (R) of -0.620 and weighted average of 18.3%. Similarly, the statistical analysis conducted on geographies consisting of 130,300,683 people shows a weak negative correlation between the proportion of Immigrants from Cameroon and poverty level among single females in the United States with a correlation coefficient (R) of -0.236 and weighted average of 19.8%, a difference of 8.5%.
Single Female Poverty Correlation Summary
| Measurement | Asian | Immigrants from Cameroon |
| Minimum | 3.9% | 1.1% |
| Maximum | 30.6% | 42.6% |
| Range | 26.7% | 41.5% |
| Mean | 15.6% | 17.7% |
| Median | 16.0% | 18.1% |
| Interquartile 25% (IQ1) | 12.7% | 12.5% |
| Interquartile 75% (IQ3) | 18.1% | 21.1% |
| Interquartile Range (IQR) | 5.4% | 8.5% |
| Standard Deviation (Sample) | 4.4% | 8.1% |
| Standard Deviation (Population) | 4.4% | 8.0% |
Similar Demographics by Single Female Poverty
Demographics Similar to Asians by Single Female Poverty
In terms of single female poverty, the demographic groups most similar to Asians are Burmese (18.3%, a difference of 0.0%), Maltese (18.3%, a difference of 0.020%), Immigrants from Greece (18.3%, a difference of 0.070%), Armenian (18.3%, a difference of 0.23%), and Immigrants from Singapore (18.3%, a difference of 0.33%).
| Demographics | Rating | Rank | Single Female Poverty |
| Iranians | 100.0 /100 | #16 | Exceptional 18.0% |
| Immigrants | Korea | 100.0 /100 | #17 | Exceptional 18.1% |
| Immigrants | Eastern Asia | 100.0 /100 | #18 | Exceptional 18.1% |
| Immigrants | China | 100.0 /100 | #19 | Exceptional 18.1% |
| Immigrants | Greece | 100.0 /100 | #20 | Exceptional 18.3% |
| Maltese | 100.0 /100 | #21 | Exceptional 18.3% |
| Burmese | 100.0 /100 | #22 | Exceptional 18.3% |
| Asians | 100.0 /100 | #23 | Exceptional 18.3% |
| Armenians | 100.0 /100 | #24 | Exceptional 18.3% |
| Immigrants | Singapore | 100.0 /100 | #25 | Exceptional 18.3% |
| Immigrants | Israel | 100.0 /100 | #26 | Exceptional 18.3% |
| Immigrants | Pakistan | 100.0 /100 | #27 | Exceptional 18.4% |
| Immigrants | Moldova | 100.0 /100 | #28 | Exceptional 18.5% |
| Immigrants | Poland | 100.0 /100 | #29 | Exceptional 18.5% |
| Immigrants | North Macedonia | 99.9 /100 | #30 | Exceptional 18.5% |
Demographics Similar to Immigrants from Cameroon by Single Female Poverty
In terms of single female poverty, the demographic groups most similar to Immigrants from Cameroon are Immigrants from Belgium (19.8%, a difference of 0.010%), Immigrants from Southern Europe (19.9%, a difference of 0.12%), Ukrainian (19.8%, a difference of 0.19%), Chilean (19.9%, a difference of 0.24%), and Israeli (19.9%, a difference of 0.25%).
| Demographics | Rating | Rank | Single Female Poverty |
| Estonians | 98.2 /100 | #95 | Exceptional 19.7% |
| Immigrants | Brazil | 98.2 /100 | #96 | Exceptional 19.7% |
| Croatians | 98.1 /100 | #97 | Exceptional 19.7% |
| Immigrants | France | 97.9 /100 | #98 | Exceptional 19.7% |
| Sierra Leoneans | 97.9 /100 | #99 | Exceptional 19.7% |
| Ukrainians | 97.6 /100 | #100 | Exceptional 19.8% |
| Immigrants | Belgium | 97.3 /100 | #101 | Exceptional 19.8% |
| Immigrants | Cameroon | 97.3 /100 | #102 | Exceptional 19.8% |
| Immigrants | Southern Europe | 97.1 /100 | #103 | Exceptional 19.9% |
| Chileans | 96.9 /100 | #104 | Exceptional 19.9% |
| Israelis | 96.9 /100 | #105 | Exceptional 19.9% |
| Ethiopians | 96.7 /100 | #106 | Exceptional 19.9% |
| Immigrants | Syria | 96.7 /100 | #107 | Exceptional 19.9% |
| Native Hawaiians | 96.6 /100 | #108 | Exceptional 19.9% |
| Colombians | 96.6 /100 | #109 | Exceptional 19.9% |