Asian vs Yugoslavian Single Female Poverty
COMPARE
Asian
Yugoslavian
Single Female Poverty
Single Female Poverty Comparison
Asians
Yugoslavians
18.3%
SINGLE FEMALE POVERTY
100.0/ 100
METRIC RATING
23rd/ 347
METRIC RANK
21.2%
SINGLE FEMALE POVERTY
35.4/ 100
METRIC RATING
188th/ 347
METRIC RANK
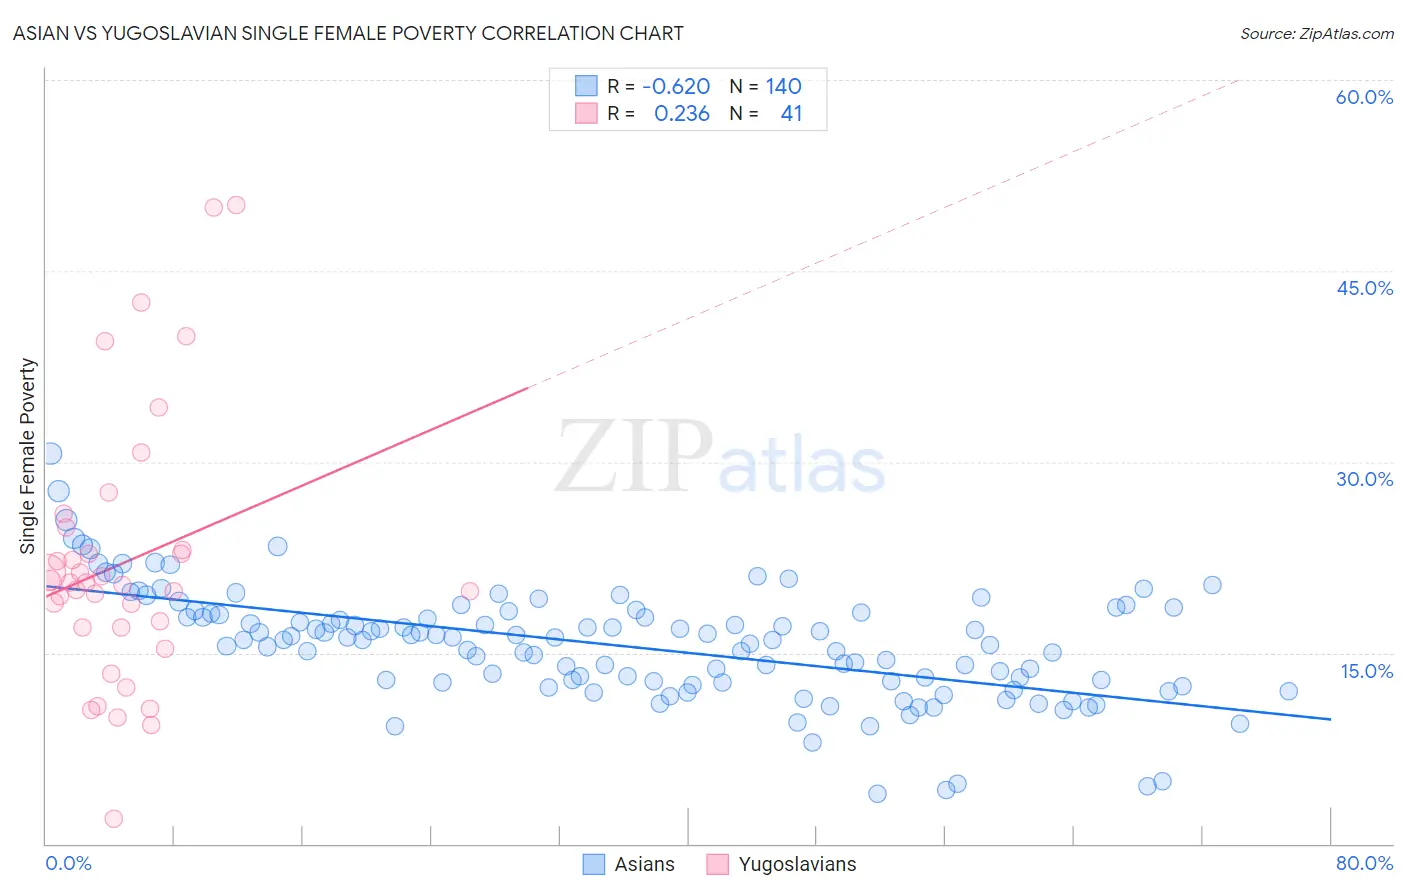
Asian vs Yugoslavian Single Female Poverty Correlation Chart
The statistical analysis conducted on geographies consisting of 534,134,882 people shows a significant negative correlation between the proportion of Asians and poverty level among single females in the United States with a correlation coefficient (R) of -0.620 and weighted average of 18.3%. Similarly, the statistical analysis conducted on geographies consisting of 282,795,313 people shows a weak positive correlation between the proportion of Yugoslavians and poverty level among single females in the United States with a correlation coefficient (R) of 0.236 and weighted average of 21.2%, a difference of 16.0%.
Single Female Poverty Correlation Summary
| Measurement | Asian | Yugoslavian |
| Minimum | 3.9% | 2.0% |
| Maximum | 30.6% | 50.2% |
| Range | 26.7% | 48.2% |
| Mean | 15.6% | 22.1% |
| Median | 16.0% | 20.5% |
| Interquartile 25% (IQ1) | 12.7% | 17.0% |
| Interquartile 75% (IQ3) | 18.1% | 23.9% |
| Interquartile Range (IQR) | 5.4% | 7.0% |
| Standard Deviation (Sample) | 4.4% | 10.4% |
| Standard Deviation (Population) | 4.4% | 10.3% |
Similar Demographics by Single Female Poverty
Demographics Similar to Asians by Single Female Poverty
In terms of single female poverty, the demographic groups most similar to Asians are Burmese (18.3%, a difference of 0.0%), Maltese (18.3%, a difference of 0.020%), Immigrants from Greece (18.3%, a difference of 0.070%), Armenian (18.3%, a difference of 0.23%), and Immigrants from Singapore (18.3%, a difference of 0.33%).
| Demographics | Rating | Rank | Single Female Poverty |
| Iranians | 100.0 /100 | #16 | Exceptional 18.0% |
| Immigrants | Korea | 100.0 /100 | #17 | Exceptional 18.1% |
| Immigrants | Eastern Asia | 100.0 /100 | #18 | Exceptional 18.1% |
| Immigrants | China | 100.0 /100 | #19 | Exceptional 18.1% |
| Immigrants | Greece | 100.0 /100 | #20 | Exceptional 18.3% |
| Maltese | 100.0 /100 | #21 | Exceptional 18.3% |
| Burmese | 100.0 /100 | #22 | Exceptional 18.3% |
| Asians | 100.0 /100 | #23 | Exceptional 18.3% |
| Armenians | 100.0 /100 | #24 | Exceptional 18.3% |
| Immigrants | Singapore | 100.0 /100 | #25 | Exceptional 18.3% |
| Immigrants | Israel | 100.0 /100 | #26 | Exceptional 18.3% |
| Immigrants | Pakistan | 100.0 /100 | #27 | Exceptional 18.4% |
| Immigrants | Moldova | 100.0 /100 | #28 | Exceptional 18.5% |
| Immigrants | Poland | 100.0 /100 | #29 | Exceptional 18.5% |
| Immigrants | North Macedonia | 99.9 /100 | #30 | Exceptional 18.5% |
Demographics Similar to Yugoslavians by Single Female Poverty
In terms of single female poverty, the demographic groups most similar to Yugoslavians are Immigrants from Cuba (21.2%, a difference of 0.010%), Trinidadian and Tobagonian (21.2%, a difference of 0.010%), Immigrants from Nigeria (21.2%, a difference of 0.090%), Hawaiian (21.2%, a difference of 0.15%), and Immigrants from Cambodia (21.2%, a difference of 0.19%).
| Demographics | Rating | Rank | Single Female Poverty |
| Europeans | 42.3 /100 | #181 | Average 21.1% |
| Slavs | 40.5 /100 | #182 | Average 21.1% |
| Slovaks | 39.7 /100 | #183 | Fair 21.1% |
| Hungarians | 39.6 /100 | #184 | Fair 21.1% |
| Immigrants | Cambodia | 38.2 /100 | #185 | Fair 21.2% |
| Hawaiians | 37.7 /100 | #186 | Fair 21.2% |
| Immigrants | Nigeria | 36.8 /100 | #187 | Fair 21.2% |
| Yugoslavians | 35.4 /100 | #188 | Fair 21.2% |
| Immigrants | Cuba | 35.3 /100 | #189 | Fair 21.2% |
| Trinidadians and Tobagonians | 35.2 /100 | #190 | Fair 21.2% |
| Immigrants | Germany | 31.1 /100 | #191 | Fair 21.3% |
| Immigrants | Jamaica | 30.5 /100 | #192 | Fair 21.3% |
| Basques | 28.1 /100 | #193 | Fair 21.3% |
| Czechoslovakians | 27.7 /100 | #194 | Fair 21.3% |
| Nicaraguans | 27.6 /100 | #195 | Fair 21.3% |