Apache vs Immigrants from China Female Poverty
COMPARE
Apache
Immigrants from China
Female Poverty
Female Poverty Comparison
Apache
Immigrants from China
19.2%
FEMALE POVERTY
0.0/ 100
METRIC RATING
332nd/ 347
METRIC RANK
12.5%
FEMALE POVERTY
94.5/ 100
METRIC RATING
102nd/ 347
METRIC RANK
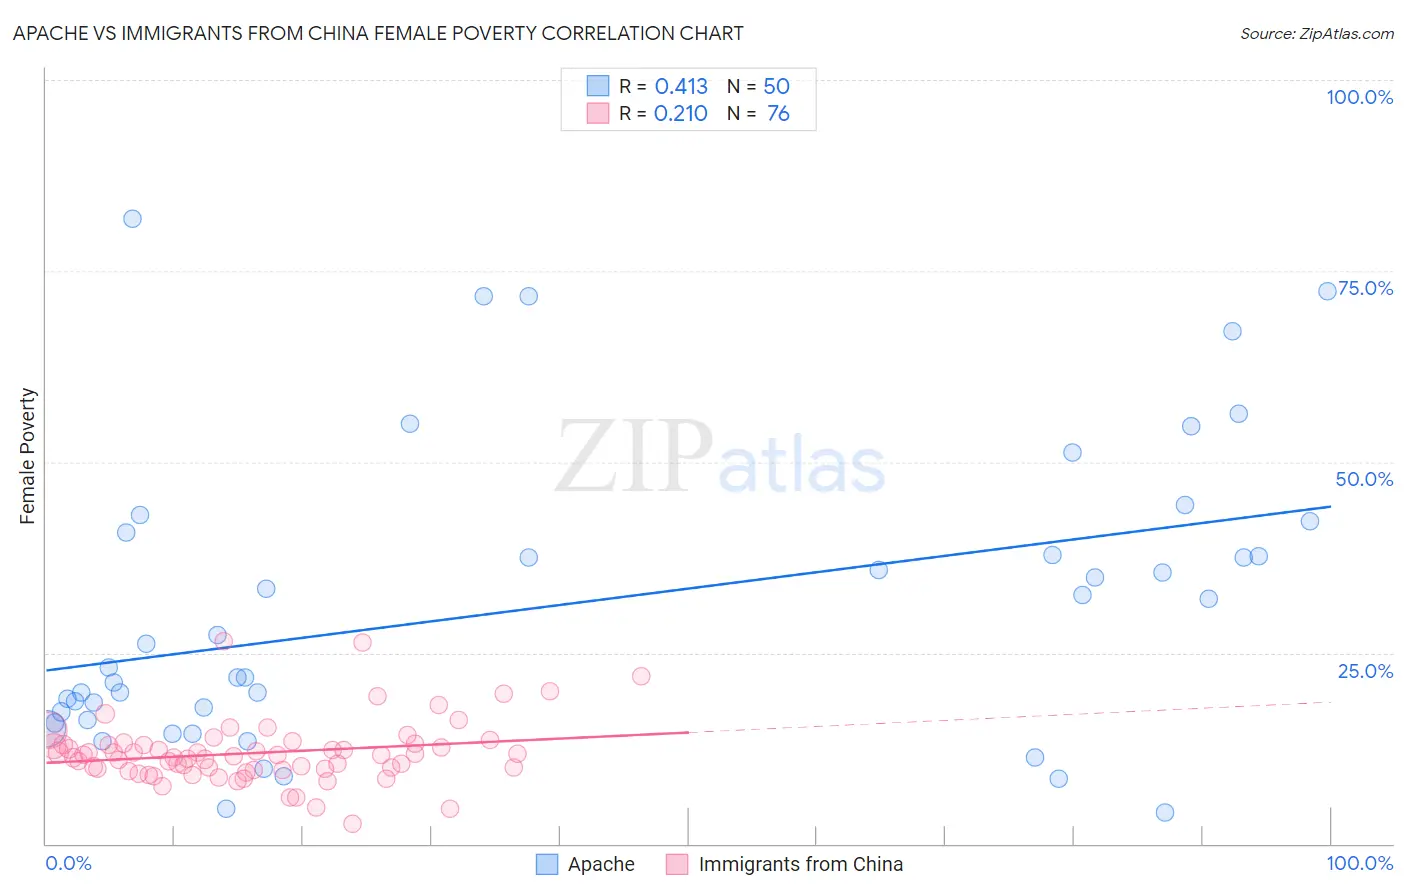
Apache vs Immigrants from China Female Poverty Correlation Chart
The statistical analysis conducted on geographies consisting of 230,999,825 people shows a moderate positive correlation between the proportion of Apache and poverty level among females in the United States with a correlation coefficient (R) of 0.413 and weighted average of 19.2%. Similarly, the statistical analysis conducted on geographies consisting of 456,442,741 people shows a weak positive correlation between the proportion of Immigrants from China and poverty level among females in the United States with a correlation coefficient (R) of 0.210 and weighted average of 12.5%, a difference of 53.6%.
Female Poverty Correlation Summary
| Measurement | Apache | Immigrants from China |
| Minimum | 4.1% | 2.6% |
| Maximum | 81.8% | 26.5% |
| Range | 77.7% | 23.9% |
| Mean | 31.0% | 11.9% |
| Median | 24.6% | 11.5% |
| Interquartile 25% (IQ1) | 16.2% | 9.7% |
| Interquartile 75% (IQ3) | 40.7% | 13.0% |
| Interquartile Range (IQR) | 24.5% | 3.3% |
| Standard Deviation (Sample) | 19.5% | 4.1% |
| Standard Deviation (Population) | 19.3% | 4.1% |
Similar Demographics by Female Poverty
Demographics Similar to Apache by Female Poverty
In terms of female poverty, the demographic groups most similar to Apache are Native/Alaskan (19.2%, a difference of 0.16%), Dominican (19.1%, a difference of 0.58%), Immigrants from Dominican Republic (19.3%, a difference of 0.60%), Kiowa (18.6%, a difference of 3.3%), and Black/African American (18.6%, a difference of 3.5%).
| Demographics | Rating | Rank | Female Poverty |
| Colville | 0.0 /100 | #325 | Tragic 17.8% |
| Central American Indians | 0.0 /100 | #326 | Tragic 18.0% |
| Yakama | 0.0 /100 | #327 | Tragic 18.0% |
| Blacks/African Americans | 0.0 /100 | #328 | Tragic 18.6% |
| Kiowa | 0.0 /100 | #329 | Tragic 18.6% |
| Dominicans | 0.0 /100 | #330 | Tragic 19.1% |
| Natives/Alaskans | 0.0 /100 | #331 | Tragic 19.2% |
| Apache | 0.0 /100 | #332 | Tragic 19.2% |
| Immigrants | Dominican Republic | 0.0 /100 | #333 | Tragic 19.3% |
| Houma | 0.0 /100 | #334 | Tragic 20.0% |
| Cheyenne | 0.0 /100 | #335 | Tragic 20.2% |
| Pueblo | 0.0 /100 | #336 | Tragic 20.7% |
| Yuman | 0.0 /100 | #337 | Tragic 20.8% |
| Sioux | 0.0 /100 | #338 | Tragic 20.9% |
| Hopi | 0.0 /100 | #339 | Tragic 21.0% |
Demographics Similar to Immigrants from China by Female Poverty
In terms of female poverty, the demographic groups most similar to Immigrants from China are Slavic (12.5%, a difference of 0.020%), Palestinian (12.5%, a difference of 0.11%), Immigrants from Latvia (12.5%, a difference of 0.15%), Tlingit-Haida (12.5%, a difference of 0.15%), and Scottish (12.5%, a difference of 0.22%).
| Demographics | Rating | Rank | Female Poverty |
| Immigrants | South Africa | 95.4 /100 | #95 | Exceptional 12.5% |
| British | 95.2 /100 | #96 | Exceptional 12.5% |
| Australians | 95.2 /100 | #97 | Exceptional 12.5% |
| Native Hawaiians | 95.1 /100 | #98 | Exceptional 12.5% |
| Romanians | 95.1 /100 | #99 | Exceptional 12.5% |
| Immigrants | Latvia | 94.8 /100 | #100 | Exceptional 12.5% |
| Tlingit-Haida | 94.8 /100 | #101 | Exceptional 12.5% |
| Immigrants | China | 94.5 /100 | #102 | Exceptional 12.5% |
| Slavs | 94.5 /100 | #103 | Exceptional 12.5% |
| Palestinians | 94.3 /100 | #104 | Exceptional 12.5% |
| Scottish | 94.1 /100 | #105 | Exceptional 12.5% |
| Immigrants | Turkey | 93.8 /100 | #106 | Exceptional 12.6% |
| Laotians | 93.4 /100 | #107 | Exceptional 12.6% |
| Portuguese | 93.1 /100 | #108 | Exceptional 12.6% |
| Immigrants | Zimbabwe | 93.1 /100 | #109 | Exceptional 12.6% |