Bahamian vs Immigrants from China Female Poverty
COMPARE
Bahamian
Immigrants from China
Female Poverty
Female Poverty Comparison
Bahamians
Immigrants from China
16.6%
FEMALE POVERTY
0.0/ 100
METRIC RATING
300th/ 347
METRIC RANK
12.5%
FEMALE POVERTY
94.5/ 100
METRIC RATING
102nd/ 347
METRIC RANK
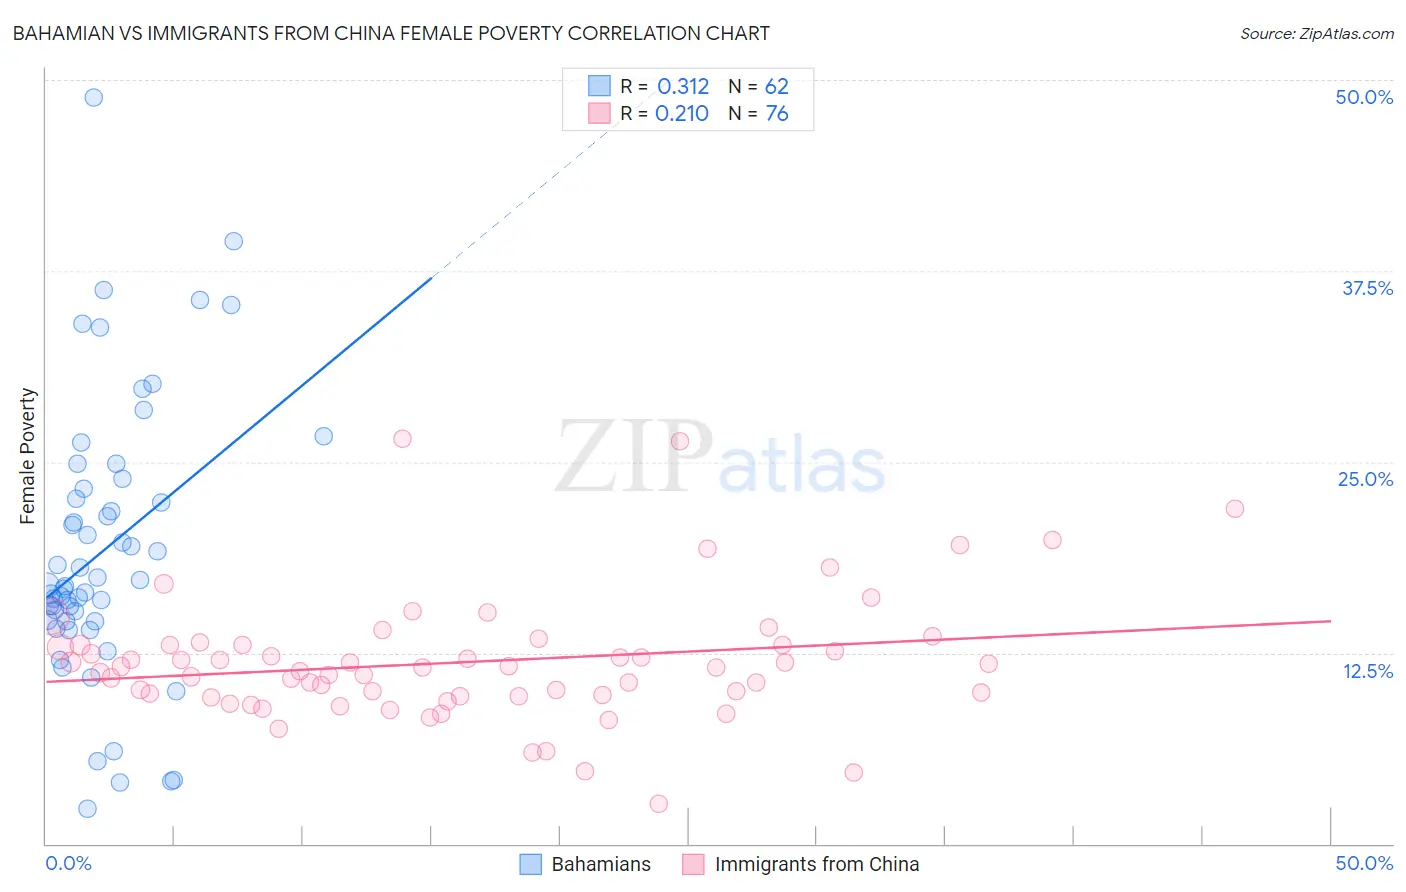
Bahamian vs Immigrants from China Female Poverty Correlation Chart
The statistical analysis conducted on geographies consisting of 112,629,599 people shows a mild positive correlation between the proportion of Bahamians and poverty level among females in the United States with a correlation coefficient (R) of 0.312 and weighted average of 16.6%. Similarly, the statistical analysis conducted on geographies consisting of 456,442,741 people shows a weak positive correlation between the proportion of Immigrants from China and poverty level among females in the United States with a correlation coefficient (R) of 0.210 and weighted average of 12.5%, a difference of 33.0%.
Female Poverty Correlation Summary
| Measurement | Bahamian | Immigrants from China |
| Minimum | 2.3% | 2.6% |
| Maximum | 48.8% | 26.5% |
| Range | 46.5% | 23.9% |
| Mean | 19.2% | 11.9% |
| Median | 16.9% | 11.5% |
| Interquartile 25% (IQ1) | 14.6% | 9.7% |
| Interquartile 75% (IQ3) | 23.2% | 13.0% |
| Interquartile Range (IQR) | 8.7% | 3.3% |
| Standard Deviation (Sample) | 9.1% | 4.1% |
| Standard Deviation (Population) | 9.0% | 4.1% |
Similar Demographics by Female Poverty
Demographics Similar to Bahamians by Female Poverty
In terms of female poverty, the demographic groups most similar to Bahamians are Hispanic or Latino (16.6%, a difference of 0.040%), Guatemalan (16.7%, a difference of 0.33%), Chippewa (16.7%, a difference of 0.36%), Somali (16.6%, a difference of 0.56%), and Mexican (16.5%, a difference of 0.77%).
| Demographics | Rating | Rank | Female Poverty |
| Immigrants | Latin America | 0.0 /100 | #293 | Tragic 16.4% |
| Immigrants | Cabo Verde | 0.0 /100 | #294 | Tragic 16.4% |
| Senegalese | 0.0 /100 | #295 | Tragic 16.5% |
| Immigrants | Senegal | 0.0 /100 | #296 | Tragic 16.5% |
| Mexicans | 0.0 /100 | #297 | Tragic 16.5% |
| Somalis | 0.0 /100 | #298 | Tragic 16.6% |
| Hispanics or Latinos | 0.0 /100 | #299 | Tragic 16.6% |
| Bahamians | 0.0 /100 | #300 | Tragic 16.6% |
| Guatemalans | 0.0 /100 | #301 | Tragic 16.7% |
| Chippewa | 0.0 /100 | #302 | Tragic 16.7% |
| Choctaw | 0.0 /100 | #303 | Tragic 16.8% |
| Immigrants | Central America | 0.0 /100 | #304 | Tragic 16.8% |
| Immigrants | Grenada | 0.0 /100 | #305 | Tragic 16.8% |
| Immigrants | Caribbean | 0.0 /100 | #306 | Tragic 16.9% |
| Seminole | 0.0 /100 | #307 | Tragic 16.9% |
Demographics Similar to Immigrants from China by Female Poverty
In terms of female poverty, the demographic groups most similar to Immigrants from China are Slavic (12.5%, a difference of 0.020%), Palestinian (12.5%, a difference of 0.11%), Immigrants from Latvia (12.5%, a difference of 0.15%), Tlingit-Haida (12.5%, a difference of 0.15%), and Scottish (12.5%, a difference of 0.22%).
| Demographics | Rating | Rank | Female Poverty |
| Immigrants | South Africa | 95.4 /100 | #95 | Exceptional 12.5% |
| British | 95.2 /100 | #96 | Exceptional 12.5% |
| Australians | 95.2 /100 | #97 | Exceptional 12.5% |
| Native Hawaiians | 95.1 /100 | #98 | Exceptional 12.5% |
| Romanians | 95.1 /100 | #99 | Exceptional 12.5% |
| Immigrants | Latvia | 94.8 /100 | #100 | Exceptional 12.5% |
| Tlingit-Haida | 94.8 /100 | #101 | Exceptional 12.5% |
| Immigrants | China | 94.5 /100 | #102 | Exceptional 12.5% |
| Slavs | 94.5 /100 | #103 | Exceptional 12.5% |
| Palestinians | 94.3 /100 | #104 | Exceptional 12.5% |
| Scottish | 94.1 /100 | #105 | Exceptional 12.5% |
| Immigrants | Turkey | 93.8 /100 | #106 | Exceptional 12.6% |
| Laotians | 93.4 /100 | #107 | Exceptional 12.6% |
| Portuguese | 93.1 /100 | #108 | Exceptional 12.6% |
| Immigrants | Zimbabwe | 93.1 /100 | #109 | Exceptional 12.6% |