Apache vs Immigrants from Chile Female Poverty
COMPARE
Apache
Immigrants from Chile
Female Poverty
Female Poverty Comparison
Apache
Immigrants from Chile
19.2%
FEMALE POVERTY
0.0/ 100
METRIC RATING
332nd/ 347
METRIC RANK
13.3%
FEMALE POVERTY
57.4/ 100
METRIC RATING
167th/ 347
METRIC RANK
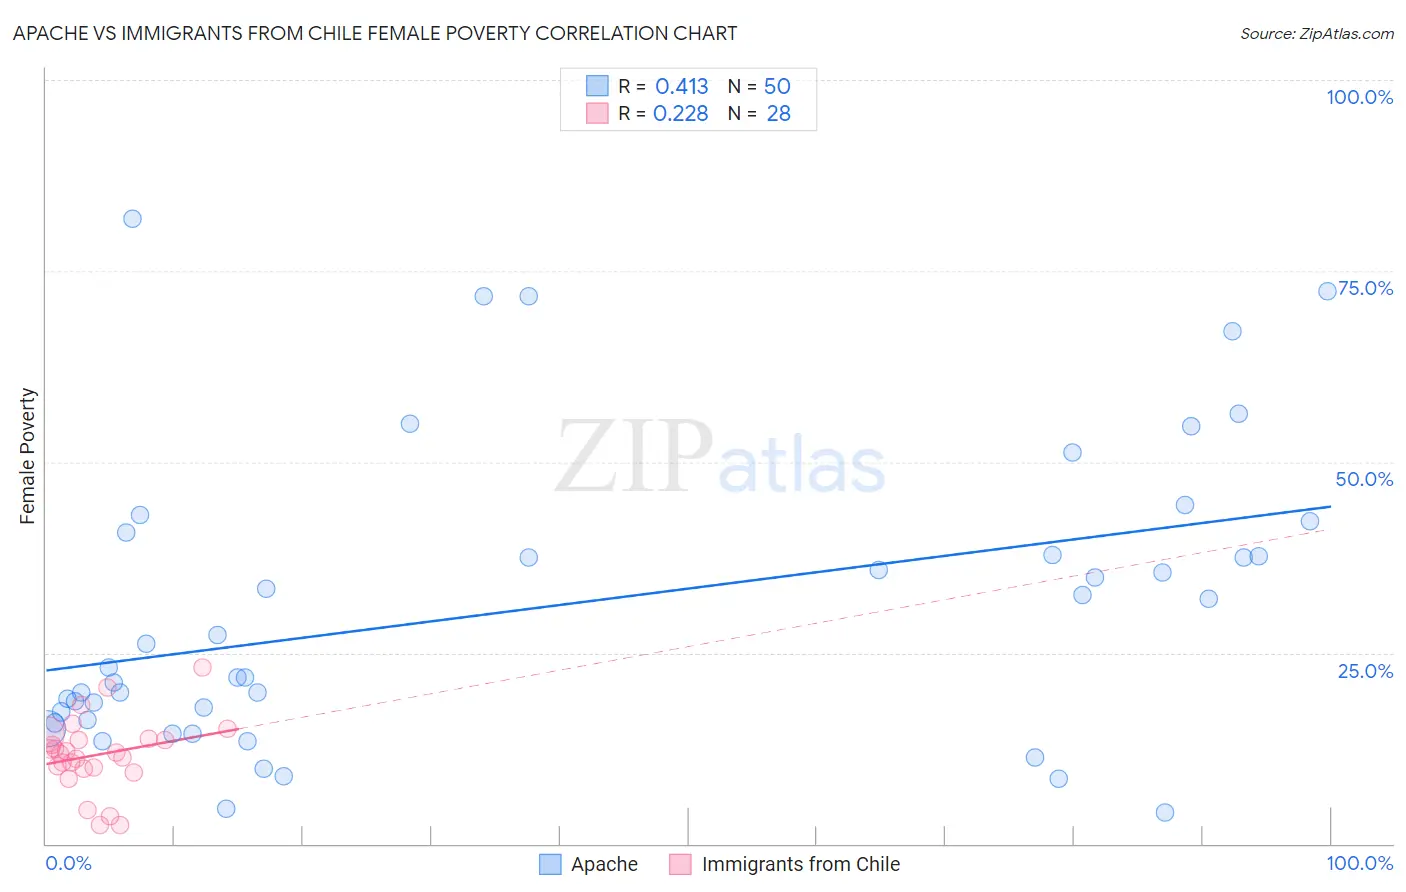
Apache vs Immigrants from Chile Female Poverty Correlation Chart
The statistical analysis conducted on geographies consisting of 230,999,825 people shows a moderate positive correlation between the proportion of Apache and poverty level among females in the United States with a correlation coefficient (R) of 0.413 and weighted average of 19.2%. Similarly, the statistical analysis conducted on geographies consisting of 218,592,418 people shows a weak positive correlation between the proportion of Immigrants from Chile and poverty level among females in the United States with a correlation coefficient (R) of 0.228 and weighted average of 13.3%, a difference of 44.1%.
Female Poverty Correlation Summary
| Measurement | Apache | Immigrants from Chile |
| Minimum | 4.1% | 2.4% |
| Maximum | 81.8% | 23.0% |
| Range | 77.7% | 20.6% |
| Mean | 31.0% | 11.6% |
| Median | 24.6% | 11.8% |
| Interquartile 25% (IQ1) | 16.2% | 10.0% |
| Interquartile 75% (IQ3) | 40.7% | 13.7% |
| Interquartile Range (IQR) | 24.5% | 3.8% |
| Standard Deviation (Sample) | 19.5% | 4.8% |
| Standard Deviation (Population) | 19.3% | 4.7% |
Similar Demographics by Female Poverty
Demographics Similar to Apache by Female Poverty
In terms of female poverty, the demographic groups most similar to Apache are Native/Alaskan (19.2%, a difference of 0.16%), Dominican (19.1%, a difference of 0.58%), Immigrants from Dominican Republic (19.3%, a difference of 0.60%), Kiowa (18.6%, a difference of 3.3%), and Black/African American (18.6%, a difference of 3.5%).
| Demographics | Rating | Rank | Female Poverty |
| Colville | 0.0 /100 | #325 | Tragic 17.8% |
| Central American Indians | 0.0 /100 | #326 | Tragic 18.0% |
| Yakama | 0.0 /100 | #327 | Tragic 18.0% |
| Blacks/African Americans | 0.0 /100 | #328 | Tragic 18.6% |
| Kiowa | 0.0 /100 | #329 | Tragic 18.6% |
| Dominicans | 0.0 /100 | #330 | Tragic 19.1% |
| Natives/Alaskans | 0.0 /100 | #331 | Tragic 19.2% |
| Apache | 0.0 /100 | #332 | Tragic 19.2% |
| Immigrants | Dominican Republic | 0.0 /100 | #333 | Tragic 19.3% |
| Houma | 0.0 /100 | #334 | Tragic 20.0% |
| Cheyenne | 0.0 /100 | #335 | Tragic 20.2% |
| Pueblo | 0.0 /100 | #336 | Tragic 20.7% |
| Yuman | 0.0 /100 | #337 | Tragic 20.8% |
| Sioux | 0.0 /100 | #338 | Tragic 20.9% |
| Hopi | 0.0 /100 | #339 | Tragic 21.0% |
Demographics Similar to Immigrants from Chile by Female Poverty
In terms of female poverty, the demographic groups most similar to Immigrants from Chile are Aleut (13.4%, a difference of 0.060%), Lebanese (13.4%, a difference of 0.14%), Colombian (13.4%, a difference of 0.16%), Immigrants from Oceania (13.3%, a difference of 0.24%), and White/Caucasian (13.4%, a difference of 0.27%).
| Demographics | Rating | Rank | Female Poverty |
| Immigrants | Nepal | 62.7 /100 | #160 | Good 13.3% |
| Immigrants | Ethiopia | 62.5 /100 | #161 | Good 13.3% |
| Guamanians/Chamorros | 62.4 /100 | #162 | Good 13.3% |
| Immigrants | Albania | 62.4 /100 | #163 | Good 13.3% |
| Ethiopians | 62.3 /100 | #164 | Good 13.3% |
| Scotch-Irish | 62.1 /100 | #165 | Good 13.3% |
| Immigrants | Oceania | 59.7 /100 | #166 | Average 13.3% |
| Immigrants | Chile | 57.4 /100 | #167 | Average 13.3% |
| Aleuts | 56.7 /100 | #168 | Average 13.4% |
| Lebanese | 55.9 /100 | #169 | Average 13.4% |
| Colombians | 55.7 /100 | #170 | Average 13.4% |
| Whites/Caucasians | 54.6 /100 | #171 | Average 13.4% |
| Mongolians | 53.6 /100 | #172 | Average 13.4% |
| Immigrants | Afghanistan | 50.8 /100 | #173 | Average 13.4% |
| Immigrants | Iraq | 50.0 /100 | #174 | Average 13.4% |