Osage vs Immigrants from China Female Poverty
COMPARE
Osage
Immigrants from China
Female Poverty
Female Poverty Comparison
Osage
Immigrants from China
14.8%
FEMALE POVERTY
1.5/ 100
METRIC RATING
232nd/ 347
METRIC RANK
12.5%
FEMALE POVERTY
94.5/ 100
METRIC RATING
102nd/ 347
METRIC RANK
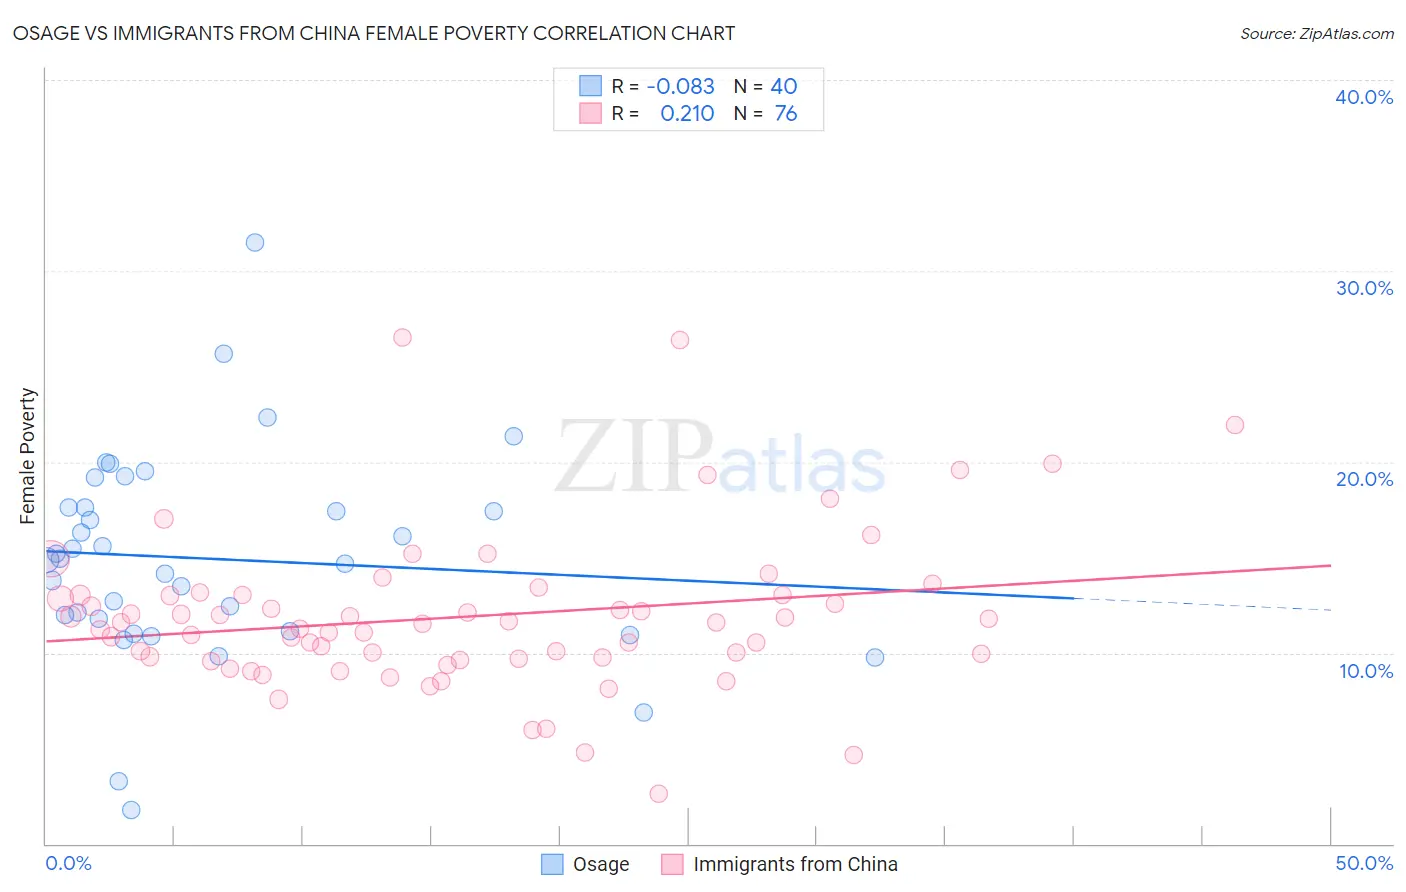
Osage vs Immigrants from China Female Poverty Correlation Chart
The statistical analysis conducted on geographies consisting of 91,795,919 people shows a slight negative correlation between the proportion of Osage and poverty level among females in the United States with a correlation coefficient (R) of -0.083 and weighted average of 14.8%. Similarly, the statistical analysis conducted on geographies consisting of 456,442,741 people shows a weak positive correlation between the proportion of Immigrants from China and poverty level among females in the United States with a correlation coefficient (R) of 0.210 and weighted average of 12.5%, a difference of 18.2%.
Female Poverty Correlation Summary
| Measurement | Osage | Immigrants from China |
| Minimum | 1.8% | 2.6% |
| Maximum | 31.5% | 26.5% |
| Range | 29.7% | 23.9% |
| Mean | 14.9% | 11.9% |
| Median | 14.9% | 11.5% |
| Interquartile 25% (IQ1) | 11.4% | 9.7% |
| Interquartile 75% (IQ3) | 17.6% | 13.0% |
| Interquartile Range (IQR) | 6.2% | 3.3% |
| Standard Deviation (Sample) | 5.5% | 4.1% |
| Standard Deviation (Population) | 5.4% | 4.1% |
Similar Demographics by Female Poverty
Demographics Similar to Osage by Female Poverty
In terms of female poverty, the demographic groups most similar to Osage are Immigrants from Saudi Arabia (14.8%, a difference of 0.10%), Nigerian (14.8%, a difference of 0.31%), Alaska Native (14.7%, a difference of 0.41%), Ghanaian (14.7%, a difference of 0.61%), and Fijian (14.9%, a difference of 0.62%).
| Demographics | Rating | Rank | Female Poverty |
| Immigrants | Micronesia | 2.8 /100 | #225 | Tragic 14.6% |
| Immigrants | Eritrea | 2.4 /100 | #226 | Tragic 14.6% |
| Immigrants | Nigeria | 2.1 /100 | #227 | Tragic 14.7% |
| German Russians | 2.0 /100 | #228 | Tragic 14.7% |
| Ghanaians | 1.9 /100 | #229 | Tragic 14.7% |
| Alaska Natives | 1.8 /100 | #230 | Tragic 14.7% |
| Nigerians | 1.7 /100 | #231 | Tragic 14.8% |
| Osage | 1.5 /100 | #232 | Tragic 14.8% |
| Immigrants | Saudi Arabia | 1.4 /100 | #233 | Tragic 14.8% |
| Fijians | 1.1 /100 | #234 | Tragic 14.9% |
| Immigrants | Laos | 0.9 /100 | #235 | Tragic 15.0% |
| Cree | 0.7 /100 | #236 | Tragic 15.1% |
| French American Indians | 0.6 /100 | #237 | Tragic 15.1% |
| Immigrants | Armenia | 0.6 /100 | #238 | Tragic 15.1% |
| Immigrants | Middle Africa | 0.5 /100 | #239 | Tragic 15.2% |
Demographics Similar to Immigrants from China by Female Poverty
In terms of female poverty, the demographic groups most similar to Immigrants from China are Slavic (12.5%, a difference of 0.020%), Palestinian (12.5%, a difference of 0.11%), Immigrants from Latvia (12.5%, a difference of 0.15%), Tlingit-Haida (12.5%, a difference of 0.15%), and Scottish (12.5%, a difference of 0.22%).
| Demographics | Rating | Rank | Female Poverty |
| Immigrants | South Africa | 95.4 /100 | #95 | Exceptional 12.5% |
| British | 95.2 /100 | #96 | Exceptional 12.5% |
| Australians | 95.2 /100 | #97 | Exceptional 12.5% |
| Native Hawaiians | 95.1 /100 | #98 | Exceptional 12.5% |
| Romanians | 95.1 /100 | #99 | Exceptional 12.5% |
| Immigrants | Latvia | 94.8 /100 | #100 | Exceptional 12.5% |
| Tlingit-Haida | 94.8 /100 | #101 | Exceptional 12.5% |
| Immigrants | China | 94.5 /100 | #102 | Exceptional 12.5% |
| Slavs | 94.5 /100 | #103 | Exceptional 12.5% |
| Palestinians | 94.3 /100 | #104 | Exceptional 12.5% |
| Scottish | 94.1 /100 | #105 | Exceptional 12.5% |
| Immigrants | Turkey | 93.8 /100 | #106 | Exceptional 12.6% |
| Laotians | 93.4 /100 | #107 | Exceptional 12.6% |
| Portuguese | 93.1 /100 | #108 | Exceptional 12.6% |
| Immigrants | Zimbabwe | 93.1 /100 | #109 | Exceptional 12.6% |