Apache vs Immigrants from Caribbean Female Poverty
COMPARE
Apache
Immigrants from Caribbean
Female Poverty
Female Poverty Comparison
Apache
Immigrants from Caribbean
19.2%
FEMALE POVERTY
0.0/ 100
METRIC RATING
332nd/ 347
METRIC RANK
16.9%
FEMALE POVERTY
0.0/ 100
METRIC RATING
306th/ 347
METRIC RANK
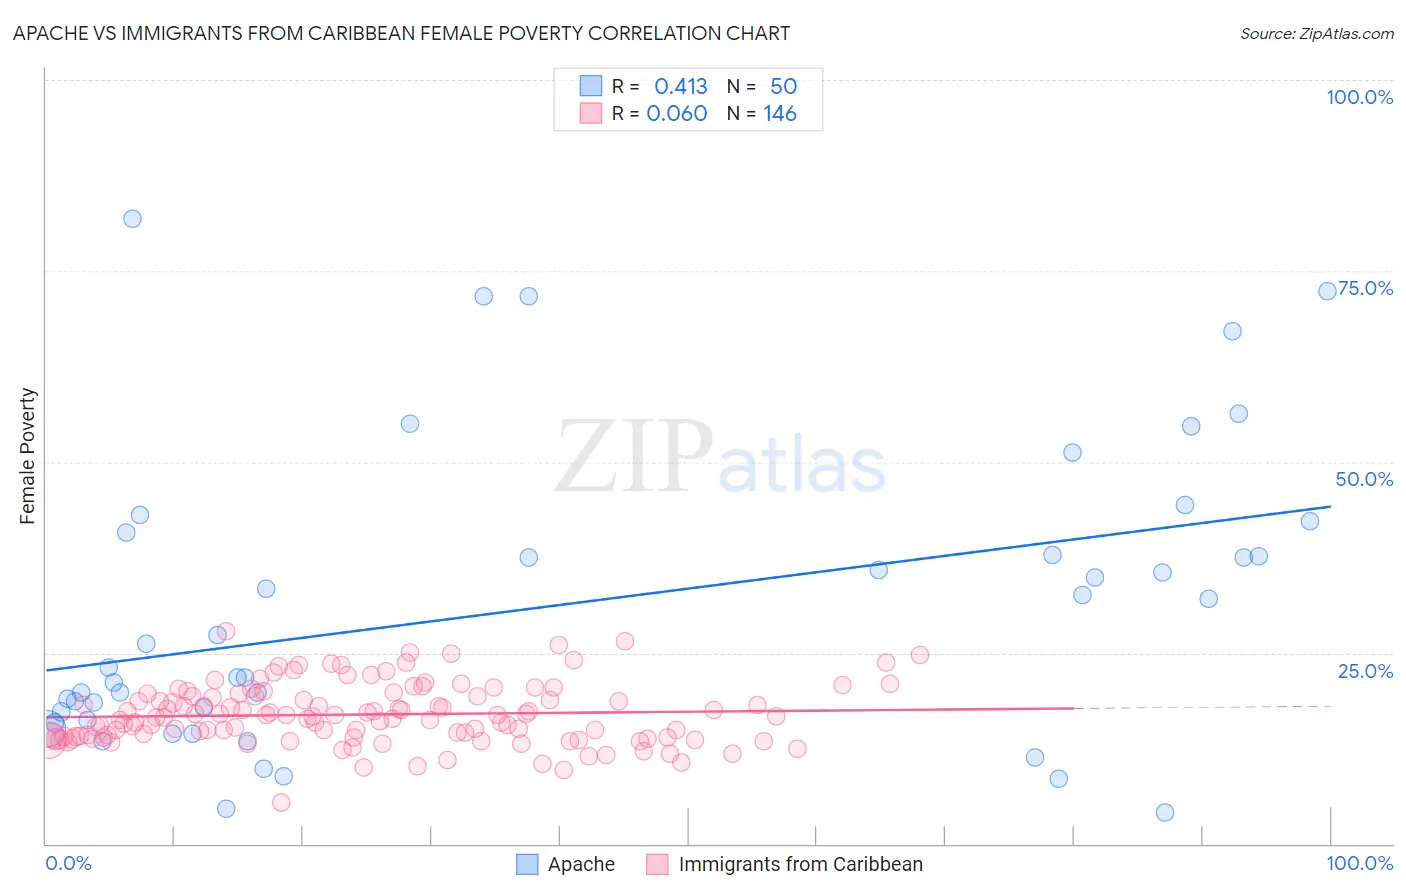
Apache vs Immigrants from Caribbean Female Poverty Correlation Chart
The statistical analysis conducted on geographies consisting of 230,999,825 people shows a moderate positive correlation between the proportion of Apache and poverty level among females in the United States with a correlation coefficient (R) of 0.413 and weighted average of 19.2%. Similarly, the statistical analysis conducted on geographies consisting of 449,490,616 people shows a slight positive correlation between the proportion of Immigrants from Caribbean and poverty level among females in the United States with a correlation coefficient (R) of 0.060 and weighted average of 16.9%, a difference of 14.0%.
Female Poverty Correlation Summary
| Measurement | Apache | Immigrants from Caribbean |
| Minimum | 4.1% | 5.4% |
| Maximum | 81.8% | 27.8% |
| Range | 77.7% | 22.4% |
| Mean | 31.0% | 16.9% |
| Median | 24.6% | 16.6% |
| Interquartile 25% (IQ1) | 16.2% | 14.0% |
| Interquartile 75% (IQ3) | 40.7% | 19.4% |
| Interquartile Range (IQR) | 24.5% | 5.3% |
| Standard Deviation (Sample) | 19.5% | 3.9% |
| Standard Deviation (Population) | 19.3% | 3.9% |
Similar Demographics by Female Poverty
Demographics Similar to Apache by Female Poverty
In terms of female poverty, the demographic groups most similar to Apache are Native/Alaskan (19.2%, a difference of 0.16%), Dominican (19.1%, a difference of 0.58%), Immigrants from Dominican Republic (19.3%, a difference of 0.60%), Kiowa (18.6%, a difference of 3.3%), and Black/African American (18.6%, a difference of 3.5%).
| Demographics | Rating | Rank | Female Poverty |
| Colville | 0.0 /100 | #325 | Tragic 17.8% |
| Central American Indians | 0.0 /100 | #326 | Tragic 18.0% |
| Yakama | 0.0 /100 | #327 | Tragic 18.0% |
| Blacks/African Americans | 0.0 /100 | #328 | Tragic 18.6% |
| Kiowa | 0.0 /100 | #329 | Tragic 18.6% |
| Dominicans | 0.0 /100 | #330 | Tragic 19.1% |
| Natives/Alaskans | 0.0 /100 | #331 | Tragic 19.2% |
| Apache | 0.0 /100 | #332 | Tragic 19.2% |
| Immigrants | Dominican Republic | 0.0 /100 | #333 | Tragic 19.3% |
| Houma | 0.0 /100 | #334 | Tragic 20.0% |
| Cheyenne | 0.0 /100 | #335 | Tragic 20.2% |
| Pueblo | 0.0 /100 | #336 | Tragic 20.7% |
| Yuman | 0.0 /100 | #337 | Tragic 20.8% |
| Sioux | 0.0 /100 | #338 | Tragic 20.9% |
| Hopi | 0.0 /100 | #339 | Tragic 21.0% |
Demographics Similar to Immigrants from Caribbean by Female Poverty
In terms of female poverty, the demographic groups most similar to Immigrants from Caribbean are Seminole (16.9%, a difference of 0.12%), African (16.9%, a difference of 0.19%), Immigrants from Central America (16.8%, a difference of 0.27%), Immigrants from Grenada (16.8%, a difference of 0.27%), and Choctaw (16.8%, a difference of 0.33%).
| Demographics | Rating | Rank | Female Poverty |
| Hispanics or Latinos | 0.0 /100 | #299 | Tragic 16.6% |
| Bahamians | 0.0 /100 | #300 | Tragic 16.6% |
| Guatemalans | 0.0 /100 | #301 | Tragic 16.7% |
| Chippewa | 0.0 /100 | #302 | Tragic 16.7% |
| Choctaw | 0.0 /100 | #303 | Tragic 16.8% |
| Immigrants | Central America | 0.0 /100 | #304 | Tragic 16.8% |
| Immigrants | Grenada | 0.0 /100 | #305 | Tragic 16.8% |
| Immigrants | Caribbean | 0.0 /100 | #306 | Tragic 16.9% |
| Seminole | 0.0 /100 | #307 | Tragic 16.9% |
| Africans | 0.0 /100 | #308 | Tragic 16.9% |
| Immigrants | Mexico | 0.0 /100 | #309 | Tragic 17.0% |
| Creek | 0.0 /100 | #310 | Tragic 17.0% |
| Immigrants | Guatemala | 0.0 /100 | #311 | Tragic 17.0% |
| Immigrants | Somalia | 0.0 /100 | #312 | Tragic 17.0% |
| British West Indians | 0.0 /100 | #313 | Tragic 17.0% |