Malaysian vs Immigrants from China Female Poverty
COMPARE
Malaysian
Immigrants from China
Female Poverty
Female Poverty Comparison
Malaysians
Immigrants from China
14.3%
FEMALE POVERTY
7.4/ 100
METRIC RATING
210th/ 347
METRIC RANK
12.5%
FEMALE POVERTY
94.5/ 100
METRIC RATING
102nd/ 347
METRIC RANK
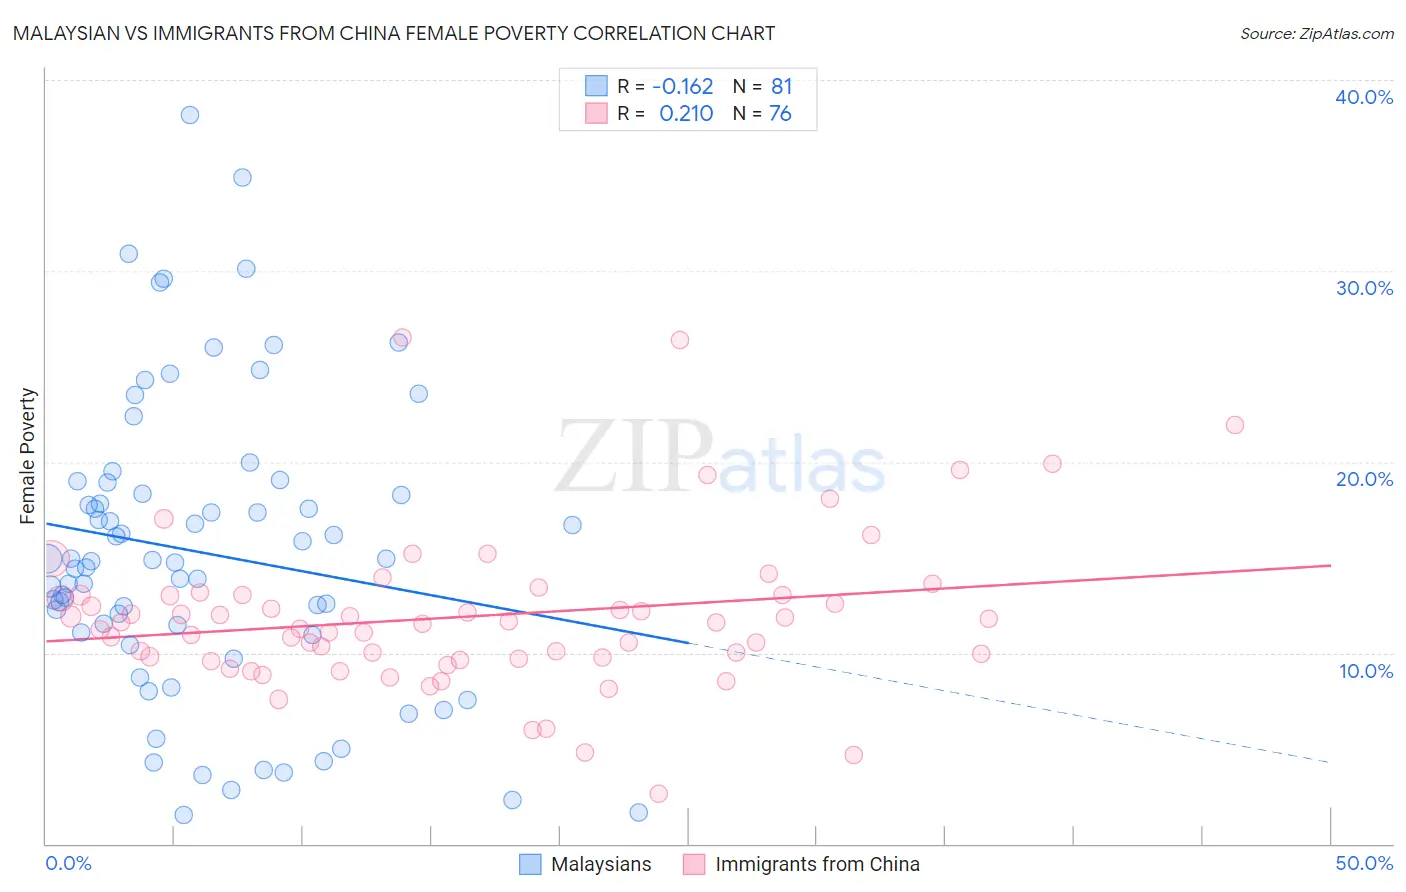
Malaysian vs Immigrants from China Female Poverty Correlation Chart
The statistical analysis conducted on geographies consisting of 225,983,571 people shows a poor negative correlation between the proportion of Malaysians and poverty level among females in the United States with a correlation coefficient (R) of -0.162 and weighted average of 14.3%. Similarly, the statistical analysis conducted on geographies consisting of 456,442,741 people shows a weak positive correlation between the proportion of Immigrants from China and poverty level among females in the United States with a correlation coefficient (R) of 0.210 and weighted average of 12.5%, a difference of 13.9%.
Female Poverty Correlation Summary
| Measurement | Malaysian | Immigrants from China |
| Minimum | 1.5% | 2.6% |
| Maximum | 38.2% | 26.5% |
| Range | 36.7% | 23.9% |
| Mean | 15.2% | 11.9% |
| Median | 14.8% | 11.5% |
| Interquartile 25% (IQ1) | 11.0% | 9.7% |
| Interquartile 75% (IQ3) | 18.7% | 13.0% |
| Interquartile Range (IQR) | 7.6% | 3.3% |
| Standard Deviation (Sample) | 7.8% | 4.1% |
| Standard Deviation (Population) | 7.7% | 4.1% |
Similar Demographics by Female Poverty
Demographics Similar to Malaysians by Female Poverty
In terms of female poverty, the demographic groups most similar to Malaysians are Panamanian (14.2%, a difference of 0.080%), Moroccan (14.3%, a difference of 0.080%), Immigrants from the Azores (14.2%, a difference of 0.15%), Immigrants from Eastern Africa (14.2%, a difference of 0.49%), and Bermudan (14.4%, a difference of 0.72%).
| Demographics | Rating | Rank | Female Poverty |
| Immigrants | Western Asia | 20.7 /100 | #203 | Fair 13.9% |
| Spaniards | 18.9 /100 | #204 | Poor 13.9% |
| Ugandans | 15.4 /100 | #205 | Poor 14.0% |
| Immigrants | Uruguay | 14.0 /100 | #206 | Poor 14.0% |
| Immigrants | Eastern Africa | 9.0 /100 | #207 | Tragic 14.2% |
| Immigrants | Azores | 7.9 /100 | #208 | Tragic 14.2% |
| Panamanians | 7.7 /100 | #209 | Tragic 14.2% |
| Malaysians | 7.4 /100 | #210 | Tragic 14.3% |
| Moroccans | 7.2 /100 | #211 | Tragic 14.3% |
| Bermudans | 5.5 /100 | #212 | Tragic 14.4% |
| Alaskan Athabascans | 5.3 /100 | #213 | Tragic 14.4% |
| Marshallese | 5.0 /100 | #214 | Tragic 14.4% |
| Immigrants | Panama | 4.7 /100 | #215 | Tragic 14.4% |
| Immigrants | Thailand | 4.5 /100 | #216 | Tragic 14.4% |
| Immigrants | Immigrants | 4.5 /100 | #217 | Tragic 14.4% |
Demographics Similar to Immigrants from China by Female Poverty
In terms of female poverty, the demographic groups most similar to Immigrants from China are Slavic (12.5%, a difference of 0.020%), Palestinian (12.5%, a difference of 0.11%), Immigrants from Latvia (12.5%, a difference of 0.15%), Tlingit-Haida (12.5%, a difference of 0.15%), and Scottish (12.5%, a difference of 0.22%).
| Demographics | Rating | Rank | Female Poverty |
| Immigrants | South Africa | 95.4 /100 | #95 | Exceptional 12.5% |
| British | 95.2 /100 | #96 | Exceptional 12.5% |
| Australians | 95.2 /100 | #97 | Exceptional 12.5% |
| Native Hawaiians | 95.1 /100 | #98 | Exceptional 12.5% |
| Romanians | 95.1 /100 | #99 | Exceptional 12.5% |
| Immigrants | Latvia | 94.8 /100 | #100 | Exceptional 12.5% |
| Tlingit-Haida | 94.8 /100 | #101 | Exceptional 12.5% |
| Immigrants | China | 94.5 /100 | #102 | Exceptional 12.5% |
| Slavs | 94.5 /100 | #103 | Exceptional 12.5% |
| Palestinians | 94.3 /100 | #104 | Exceptional 12.5% |
| Scottish | 94.1 /100 | #105 | Exceptional 12.5% |
| Immigrants | Turkey | 93.8 /100 | #106 | Exceptional 12.6% |
| Laotians | 93.4 /100 | #107 | Exceptional 12.6% |
| Portuguese | 93.1 /100 | #108 | Exceptional 12.6% |
| Immigrants | Zimbabwe | 93.1 /100 | #109 | Exceptional 12.6% |