Apache vs Immigrants from Laos Female Poverty
COMPARE
Apache
Immigrants from Laos
Female Poverty
Female Poverty Comparison
Apache
Immigrants from Laos
19.2%
FEMALE POVERTY
0.0/ 100
METRIC RATING
332nd/ 347
METRIC RANK
15.0%
FEMALE POVERTY
0.9/ 100
METRIC RATING
235th/ 347
METRIC RANK
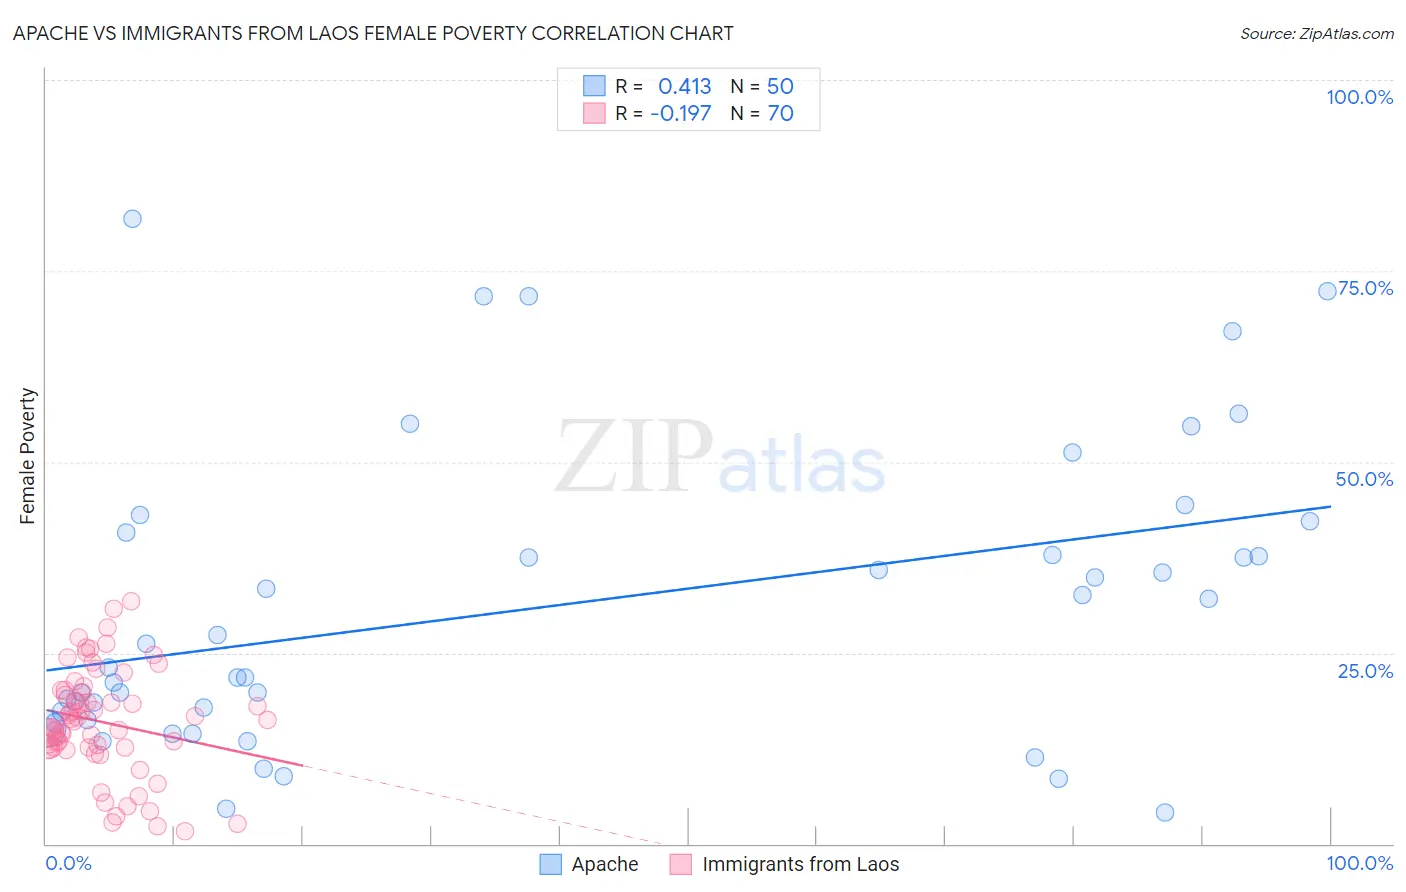
Apache vs Immigrants from Laos Female Poverty Correlation Chart
The statistical analysis conducted on geographies consisting of 230,999,825 people shows a moderate positive correlation between the proportion of Apache and poverty level among females in the United States with a correlation coefficient (R) of 0.413 and weighted average of 19.2%. Similarly, the statistical analysis conducted on geographies consisting of 201,464,148 people shows a poor negative correlation between the proportion of Immigrants from Laos and poverty level among females in the United States with a correlation coefficient (R) of -0.197 and weighted average of 15.0%, a difference of 28.5%.
Female Poverty Correlation Summary
| Measurement | Apache | Immigrants from Laos |
| Minimum | 4.1% | 1.6% |
| Maximum | 81.8% | 31.7% |
| Range | 77.7% | 30.1% |
| Mean | 31.0% | 15.9% |
| Median | 24.6% | 16.1% |
| Interquartile 25% (IQ1) | 16.2% | 12.6% |
| Interquartile 75% (IQ3) | 40.7% | 20.1% |
| Interquartile Range (IQR) | 24.5% | 7.5% |
| Standard Deviation (Sample) | 19.5% | 7.0% |
| Standard Deviation (Population) | 19.3% | 6.9% |
Similar Demographics by Female Poverty
Demographics Similar to Apache by Female Poverty
In terms of female poverty, the demographic groups most similar to Apache are Native/Alaskan (19.2%, a difference of 0.16%), Dominican (19.1%, a difference of 0.58%), Immigrants from Dominican Republic (19.3%, a difference of 0.60%), Kiowa (18.6%, a difference of 3.3%), and Black/African American (18.6%, a difference of 3.5%).
| Demographics | Rating | Rank | Female Poverty |
| Colville | 0.0 /100 | #325 | Tragic 17.8% |
| Central American Indians | 0.0 /100 | #326 | Tragic 18.0% |
| Yakama | 0.0 /100 | #327 | Tragic 18.0% |
| Blacks/African Americans | 0.0 /100 | #328 | Tragic 18.6% |
| Kiowa | 0.0 /100 | #329 | Tragic 18.6% |
| Dominicans | 0.0 /100 | #330 | Tragic 19.1% |
| Natives/Alaskans | 0.0 /100 | #331 | Tragic 19.2% |
| Apache | 0.0 /100 | #332 | Tragic 19.2% |
| Immigrants | Dominican Republic | 0.0 /100 | #333 | Tragic 19.3% |
| Houma | 0.0 /100 | #334 | Tragic 20.0% |
| Cheyenne | 0.0 /100 | #335 | Tragic 20.2% |
| Pueblo | 0.0 /100 | #336 | Tragic 20.7% |
| Yuman | 0.0 /100 | #337 | Tragic 20.8% |
| Sioux | 0.0 /100 | #338 | Tragic 20.9% |
| Hopi | 0.0 /100 | #339 | Tragic 21.0% |
Demographics Similar to Immigrants from Laos by Female Poverty
In terms of female poverty, the demographic groups most similar to Immigrants from Laos are Fijian (14.9%, a difference of 0.44%), Cree (15.1%, a difference of 0.63%), French American Indian (15.1%, a difference of 0.82%), Immigrants from Armenia (15.1%, a difference of 0.90%), and Immigrants from Saudi Arabia (14.8%, a difference of 0.96%).
| Demographics | Rating | Rank | Female Poverty |
| German Russians | 2.0 /100 | #228 | Tragic 14.7% |
| Ghanaians | 1.9 /100 | #229 | Tragic 14.7% |
| Alaska Natives | 1.8 /100 | #230 | Tragic 14.7% |
| Nigerians | 1.7 /100 | #231 | Tragic 14.8% |
| Osage | 1.5 /100 | #232 | Tragic 14.8% |
| Immigrants | Saudi Arabia | 1.4 /100 | #233 | Tragic 14.8% |
| Fijians | 1.1 /100 | #234 | Tragic 14.9% |
| Immigrants | Laos | 0.9 /100 | #235 | Tragic 15.0% |
| Cree | 0.7 /100 | #236 | Tragic 15.1% |
| French American Indians | 0.6 /100 | #237 | Tragic 15.1% |
| Immigrants | Armenia | 0.6 /100 | #238 | Tragic 15.1% |
| Immigrants | Middle Africa | 0.5 /100 | #239 | Tragic 15.2% |
| Sudanese | 0.5 /100 | #240 | Tragic 15.2% |
| Immigrants | Sudan | 0.4 /100 | #241 | Tragic 15.2% |
| Nepalese | 0.4 /100 | #242 | Tragic 15.2% |