Immigrants from Hong Kong vs Immigrants from Fiji Married-Couple Family Poverty
COMPARE
Immigrants from Hong Kong
Immigrants from Fiji
Married-Couple Family Poverty
Married-Couple Family Poverty Comparison
Immigrants from Hong Kong
Immigrants from Fiji
4.7%
MARRIED-COUPLE FAMILY POVERTY
96.4/ 100
METRIC RATING
109th/ 347
METRIC RANK
5.6%
MARRIED-COUPLE FAMILY POVERTY
6.7/ 100
METRIC RATING
223rd/ 347
METRIC RANK
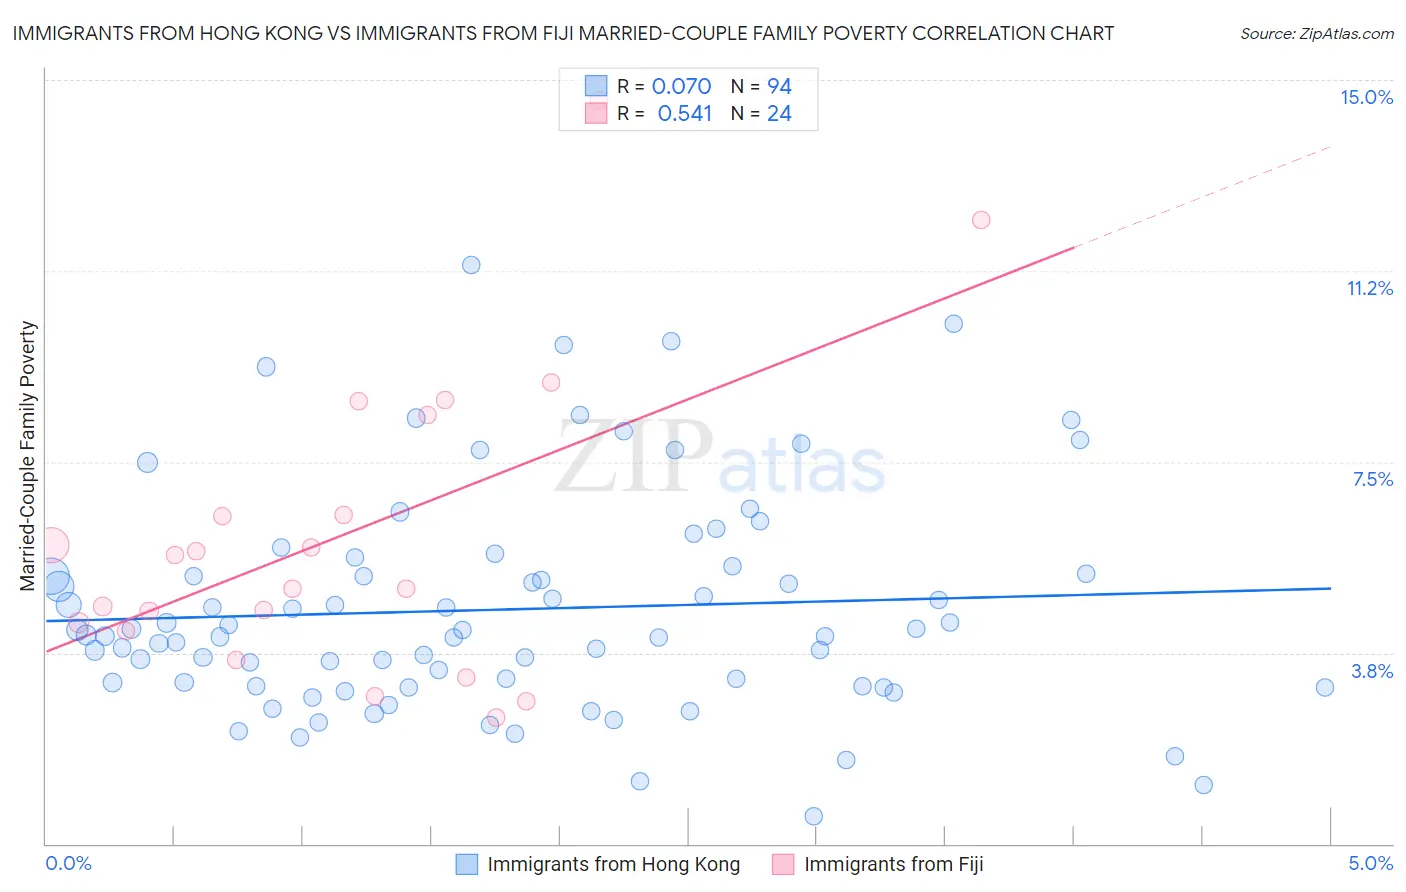
Immigrants from Hong Kong vs Immigrants from Fiji Married-Couple Family Poverty Correlation Chart
The statistical analysis conducted on geographies consisting of 252,495,550 people shows a slight positive correlation between the proportion of Immigrants from Hong Kong and poverty level among married-couple families in the United States with a correlation coefficient (R) of 0.070 and weighted average of 4.7%. Similarly, the statistical analysis conducted on geographies consisting of 93,642,085 people shows a substantial positive correlation between the proportion of Immigrants from Fiji and poverty level among married-couple families in the United States with a correlation coefficient (R) of 0.541 and weighted average of 5.6%, a difference of 19.0%.
Married-Couple Family Poverty Correlation Summary
| Measurement | Immigrants from Hong Kong | Immigrants from Fiji |
| Minimum | 0.53% | 2.5% |
| Maximum | 11.4% | 14.6% |
| Range | 10.8% | 12.1% |
| Mean | 4.6% | 6.0% |
| Median | 4.1% | 5.3% |
| Interquartile 25% (IQ1) | 3.1% | 4.3% |
| Interquartile 75% (IQ3) | 5.3% | 7.4% |
| Interquartile Range (IQR) | 2.2% | 3.2% |
| Standard Deviation (Sample) | 2.2% | 3.0% |
| Standard Deviation (Population) | 2.1% | 2.9% |
Similar Demographics by Married-Couple Family Poverty
Demographics Similar to Immigrants from Hong Kong by Married-Couple Family Poverty
In terms of married-couple family poverty, the demographic groups most similar to Immigrants from Hong Kong are Immigrants from Bolivia (4.7%, a difference of 0.16%), Laotian (4.7%, a difference of 0.20%), Pakistani (4.7%, a difference of 0.20%), Tongan (4.7%, a difference of 0.38%), and Immigrants from Nepal (4.7%, a difference of 0.45%).
| Demographics | Rating | Rank | Married-Couple Family Poverty |
| Asians | 97.6 /100 | #102 | Exceptional 4.7% |
| Immigrants | Romania | 97.3 /100 | #103 | Exceptional 4.7% |
| Immigrants | Moldova | 97.1 /100 | #104 | Exceptional 4.7% |
| Aleuts | 97.0 /100 | #105 | Exceptional 4.7% |
| Immigrants | France | 96.9 /100 | #106 | Exceptional 4.7% |
| Immigrants | Germany | 96.8 /100 | #107 | Exceptional 4.7% |
| Laotians | 96.6 /100 | #108 | Exceptional 4.7% |
| Immigrants | Hong Kong | 96.4 /100 | #109 | Exceptional 4.7% |
| Immigrants | Bolivia | 96.2 /100 | #110 | Exceptional 4.7% |
| Pakistanis | 96.2 /100 | #111 | Exceptional 4.7% |
| Tongans | 95.9 /100 | #112 | Exceptional 4.7% |
| Immigrants | Nepal | 95.9 /100 | #113 | Exceptional 4.7% |
| Immigrants | Indonesia | 95.1 /100 | #114 | Exceptional 4.8% |
| Taiwanese | 94.8 /100 | #115 | Exceptional 4.8% |
| Celtics | 94.8 /100 | #116 | Exceptional 4.8% |
Demographics Similar to Immigrants from Fiji by Married-Couple Family Poverty
In terms of married-couple family poverty, the demographic groups most similar to Immigrants from Fiji are Cajun (5.6%, a difference of 0.070%), Sudanese (5.6%, a difference of 0.11%), Immigrants from Cambodia (5.6%, a difference of 0.25%), South American (5.6%, a difference of 0.48%), and Immigrants from Zaire (5.6%, a difference of 0.49%).
| Demographics | Rating | Rank | Married-Couple Family Poverty |
| Potawatomi | 12.4 /100 | #216 | Poor 5.5% |
| Immigrants | Nigeria | 11.3 /100 | #217 | Poor 5.5% |
| Afghans | 11.2 /100 | #218 | Poor 5.5% |
| Japanese | 9.8 /100 | #219 | Tragic 5.6% |
| Colombians | 9.2 /100 | #220 | Tragic 5.6% |
| Panamanians | 9.2 /100 | #221 | Tragic 5.6% |
| Cajuns | 6.9 /100 | #222 | Tragic 5.6% |
| Immigrants | Fiji | 6.7 /100 | #223 | Tragic 5.6% |
| Sudanese | 6.4 /100 | #224 | Tragic 5.6% |
| Immigrants | Cambodia | 6.1 /100 | #225 | Tragic 5.6% |
| South Americans | 5.7 /100 | #226 | Tragic 5.6% |
| Immigrants | Zaire | 5.6 /100 | #227 | Tragic 5.6% |
| Arabs | 5.4 /100 | #228 | Tragic 5.7% |
| Sub-Saharan Africans | 4.9 /100 | #229 | Tragic 5.7% |
| Moroccans | 4.9 /100 | #230 | Tragic 5.7% |