Alsatian vs Immigrants from Fiji Median Female Earnings
COMPARE
Alsatian
Immigrants from Fiji
Median Female Earnings
Median Female Earnings Comparison
Alsatians
Immigrants from Fiji
$40,060
MEDIAN FEMALE EARNINGS
68.0/ 100
METRIC RATING
161st/ 347
METRIC RANK
$41,656
MEDIAN FEMALE EARNINGS
98.3/ 100
METRIC RATING
101st/ 347
METRIC RANK
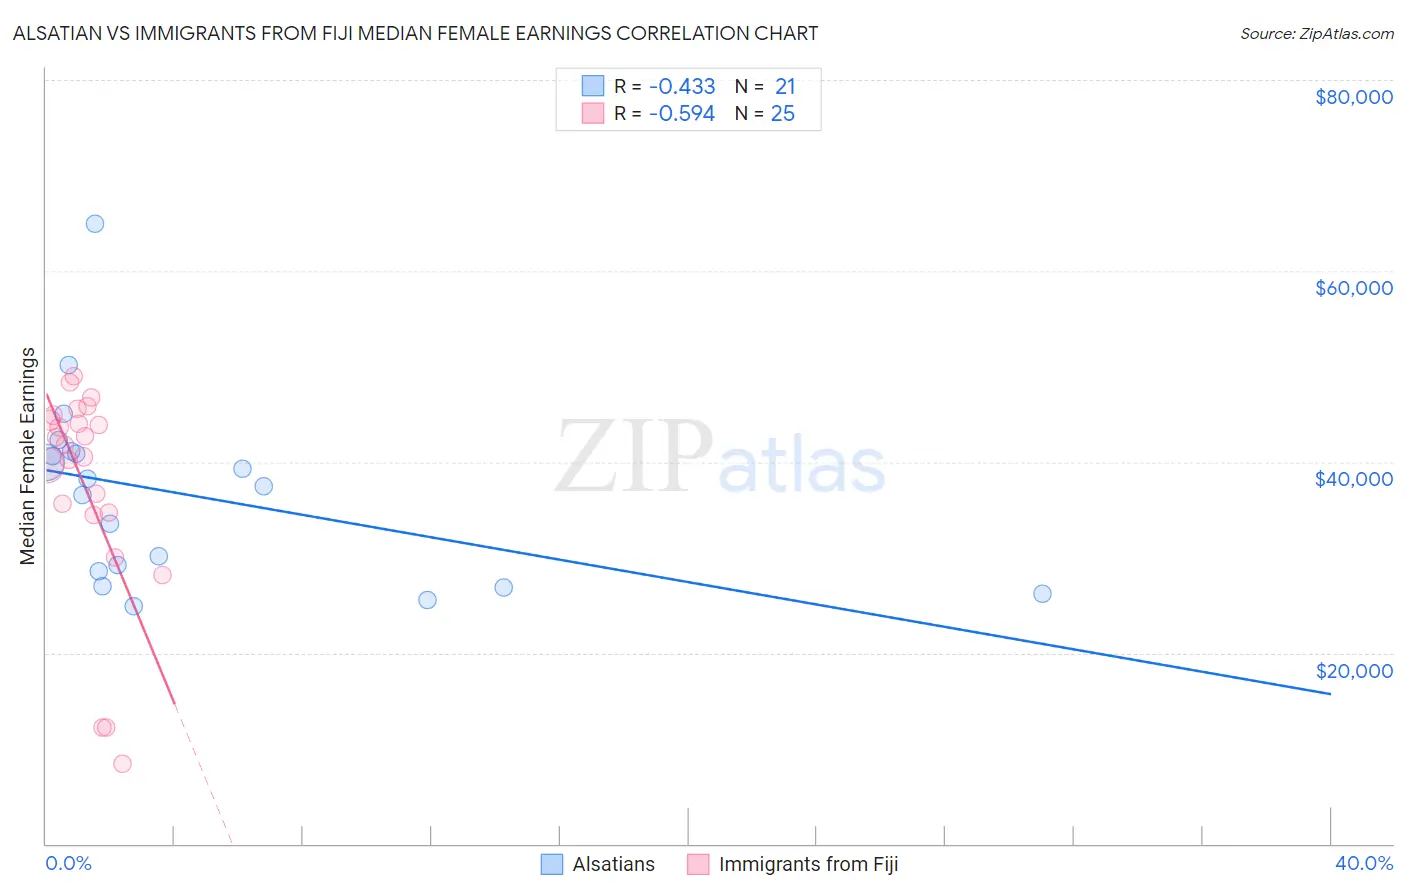
Alsatian vs Immigrants from Fiji Median Female Earnings Correlation Chart
The statistical analysis conducted on geographies consisting of 82,671,266 people shows a moderate negative correlation between the proportion of Alsatians and median female earnings in the United States with a correlation coefficient (R) of -0.433 and weighted average of $40,060. Similarly, the statistical analysis conducted on geographies consisting of 93,750,474 people shows a substantial negative correlation between the proportion of Immigrants from Fiji and median female earnings in the United States with a correlation coefficient (R) of -0.594 and weighted average of $41,656, a difference of 4.0%.
Median Female Earnings Correlation Summary
| Measurement | Alsatian | Immigrants from Fiji |
| Minimum | $24,833 | $8,380 |
| Maximum | $65,000 | $48,941 |
| Range | $40,167 | $40,561 |
| Mean | $36,577 | $37,439 |
| Median | $37,425 | $41,723 |
| Interquartile 25% (IQ1) | $27,720 | $34,596 |
| Interquartile 75% (IQ3) | $40,989 | $44,642 |
| Interquartile Range (IQR) | $13,268 | $10,046 |
| Standard Deviation (Sample) | $9,753 | $11,332 |
| Standard Deviation (Population) | $9,518 | $11,103 |
Similar Demographics by Median Female Earnings
Demographics Similar to Alsatians by Median Female Earnings
In terms of median female earnings, the demographic groups most similar to Alsatians are Inupiat ($40,080, a difference of 0.050%), South American Indian ($40,019, a difference of 0.10%), Lebanese ($40,006, a difference of 0.14%), Immigrants from Vietnam ($40,153, a difference of 0.23%), and Immigrants from Senegal ($40,157, a difference of 0.24%).
| Demographics | Rating | Rank | Median Female Earnings |
| Immigrants | Oceania | 77.6 /100 | #154 | Good $40,297 |
| Immigrants | Africa | 76.2 /100 | #155 | Good $40,257 |
| Peruvians | 75.3 /100 | #156 | Good $40,234 |
| Portuguese | 73.0 /100 | #157 | Good $40,177 |
| Immigrants | Senegal | 72.2 /100 | #158 | Good $40,157 |
| Immigrants | Vietnam | 72.0 /100 | #159 | Good $40,153 |
| Inupiat | 68.9 /100 | #160 | Good $40,080 |
| Alsatians | 68.0 /100 | #161 | Good $40,060 |
| South American Indians | 66.1 /100 | #162 | Good $40,019 |
| Lebanese | 65.5 /100 | #163 | Good $40,006 |
| Immigrants | Saudi Arabia | 62.9 /100 | #164 | Good $39,952 |
| Immigrants | Bangladesh | 60.8 /100 | #165 | Good $39,910 |
| Immigrants | Ghana | 60.0 /100 | #166 | Good $39,894 |
| Luxembourgers | 59.9 /100 | #167 | Average $39,891 |
| Immigrants | Peru | 58.9 /100 | #168 | Average $39,871 |
Demographics Similar to Immigrants from Fiji by Median Female Earnings
In terms of median female earnings, the demographic groups most similar to Immigrants from Fiji are Romanian ($41,663, a difference of 0.020%), Immigrants from Poland ($41,630, a difference of 0.060%), Immigrants from Barbados ($41,685, a difference of 0.070%), Immigrants from Argentina ($41,554, a difference of 0.25%), and Immigrants from Scotland ($41,771, a difference of 0.28%).
| Demographics | Rating | Rank | Median Female Earnings |
| Moroccans | 98.9 /100 | #94 | Exceptional $41,872 |
| Immigrants | Netherlands | 98.9 /100 | #95 | Exceptional $41,870 |
| South Africans | 98.8 /100 | #96 | Exceptional $41,825 |
| Immigrants | Hungary | 98.8 /100 | #97 | Exceptional $41,820 |
| Immigrants | Scotland | 98.7 /100 | #98 | Exceptional $41,771 |
| Immigrants | Barbados | 98.4 /100 | #99 | Exceptional $41,685 |
| Romanians | 98.3 /100 | #100 | Exceptional $41,663 |
| Immigrants | Fiji | 98.3 /100 | #101 | Exceptional $41,656 |
| Immigrants | Poland | 98.2 /100 | #102 | Exceptional $41,630 |
| Immigrants | Argentina | 97.9 /100 | #103 | Exceptional $41,554 |
| Immigrants | Zimbabwe | 97.8 /100 | #104 | Exceptional $41,527 |
| Italians | 97.7 /100 | #105 | Exceptional $41,505 |
| Immigrants | Eritrea | 97.6 /100 | #106 | Exceptional $41,485 |
| Palestinians | 97.6 /100 | #107 | Exceptional $41,484 |
| Jordanians | 97.5 /100 | #108 | Exceptional $41,464 |