Alaska Native vs Immigrants from Zaire Married-Couple Family Poverty
COMPARE
Alaska Native
Immigrants from Zaire
Married-Couple Family Poverty
Married-Couple Family Poverty Comparison
Alaska Natives
Immigrants from Zaire
6.2%
MARRIED-COUPLE FAMILY POVERTY
0.2/ 100
METRIC RATING
268th/ 347
METRIC RANK
5.6%
MARRIED-COUPLE FAMILY POVERTY
5.6/ 100
METRIC RATING
227th/ 347
METRIC RANK
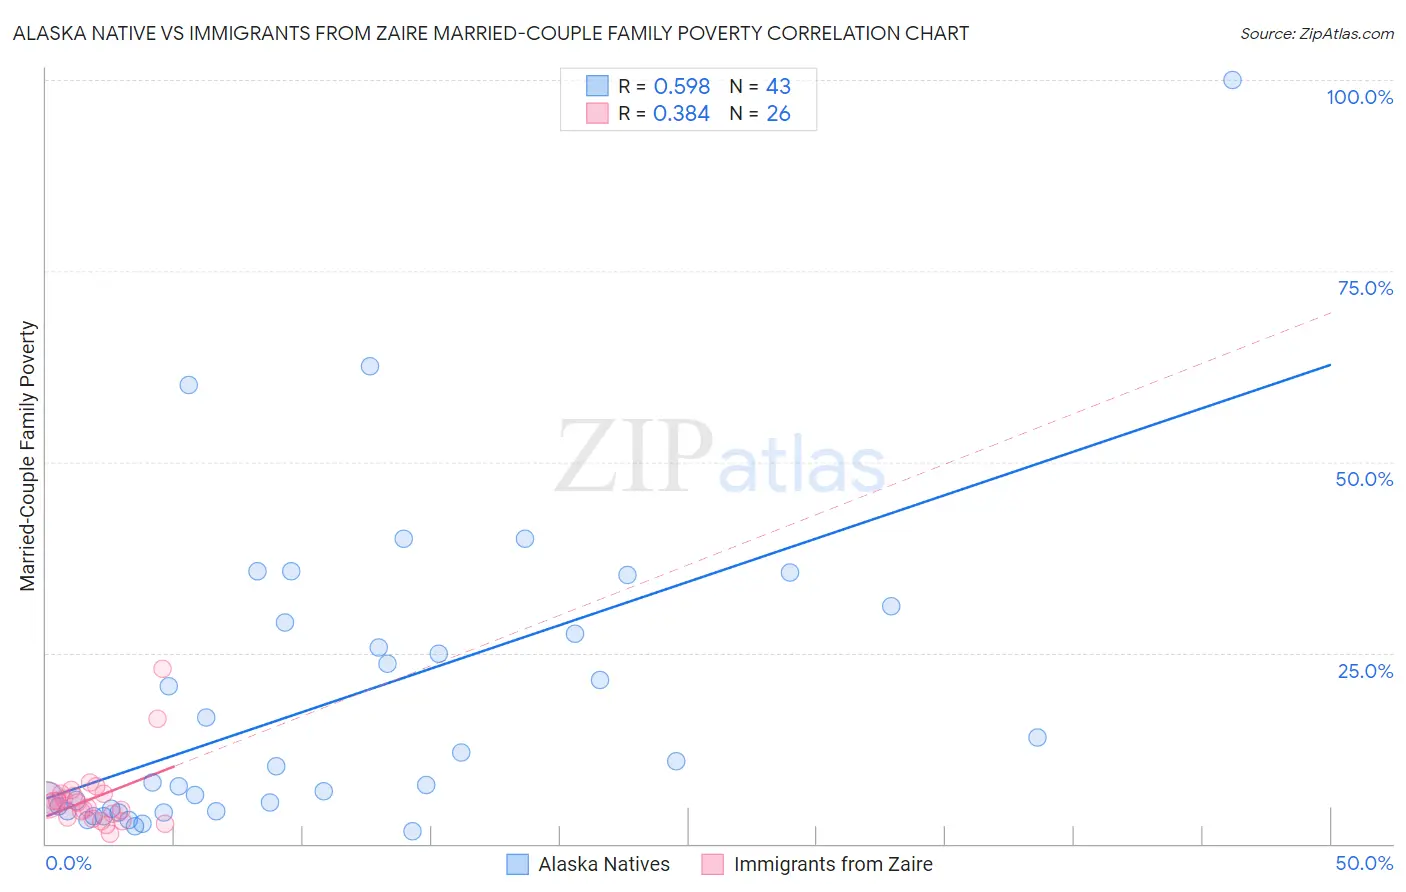
Alaska Native vs Immigrants from Zaire Married-Couple Family Poverty Correlation Chart
The statistical analysis conducted on geographies consisting of 76,597,225 people shows a substantial positive correlation between the proportion of Alaska Natives and poverty level among married-couple families in the United States with a correlation coefficient (R) of 0.598 and weighted average of 6.2%. Similarly, the statistical analysis conducted on geographies consisting of 106,970,215 people shows a mild positive correlation between the proportion of Immigrants from Zaire and poverty level among married-couple families in the United States with a correlation coefficient (R) of 0.384 and weighted average of 5.6%, a difference of 9.9%.
Married-Couple Family Poverty Correlation Summary
| Measurement | Alaska Native | Immigrants from Zaire |
| Minimum | 1.6% | 1.4% |
| Maximum | 100.0% | 22.9% |
| Range | 98.4% | 21.5% |
| Mean | 18.9% | 6.0% |
| Median | 10.2% | 5.3% |
| Interquartile 25% (IQ1) | 4.3% | 3.5% |
| Interquartile 75% (IQ3) | 28.9% | 6.5% |
| Interquartile Range (IQR) | 24.6% | 3.0% |
| Standard Deviation (Sample) | 20.2% | 4.4% |
| Standard Deviation (Population) | 19.9% | 4.4% |
Similar Demographics by Married-Couple Family Poverty
Demographics Similar to Alaska Natives by Married-Couple Family Poverty
In terms of married-couple family poverty, the demographic groups most similar to Alaska Natives are Immigrants from West Indies (6.2%, a difference of 0.17%), Immigrants from Jamaica (6.2%, a difference of 0.21%), Immigrants from Bahamas (6.2%, a difference of 0.43%), Trinidadian and Tobagonian (6.2%, a difference of 0.46%), and Spanish American (6.2%, a difference of 0.48%).
| Demographics | Rating | Rank | Married-Couple Family Poverty |
| Senegalese | 0.3 /100 | #261 | Tragic 6.1% |
| Shoshone | 0.3 /100 | #262 | Tragic 6.1% |
| Immigrants | Senegal | 0.3 /100 | #263 | Tragic 6.1% |
| Immigrants | Congo | 0.2 /100 | #264 | Tragic 6.1% |
| Blackfeet | 0.2 /100 | #265 | Tragic 6.2% |
| Creek | 0.2 /100 | #266 | Tragic 6.2% |
| Spanish Americans | 0.2 /100 | #267 | Tragic 6.2% |
| Alaska Natives | 0.2 /100 | #268 | Tragic 6.2% |
| Immigrants | West Indies | 0.1 /100 | #269 | Tragic 6.2% |
| Immigrants | Jamaica | 0.1 /100 | #270 | Tragic 6.2% |
| Immigrants | Bahamas | 0.1 /100 | #271 | Tragic 6.2% |
| Trinidadians and Tobagonians | 0.1 /100 | #272 | Tragic 6.2% |
| Colville | 0.1 /100 | #273 | Tragic 6.3% |
| Barbadians | 0.1 /100 | #274 | Tragic 6.3% |
| Choctaw | 0.1 /100 | #275 | Tragic 6.3% |
Demographics Similar to Immigrants from Zaire by Married-Couple Family Poverty
In terms of married-couple family poverty, the demographic groups most similar to Immigrants from Zaire are South American (5.6%, a difference of 0.020%), Arab (5.7%, a difference of 0.13%), Immigrants from Cambodia (5.6%, a difference of 0.24%), Sudanese (5.6%, a difference of 0.38%), and Subsaharan African (5.7%, a difference of 0.38%).
| Demographics | Rating | Rank | Married-Couple Family Poverty |
| Colombians | 9.2 /100 | #220 | Tragic 5.6% |
| Panamanians | 9.2 /100 | #221 | Tragic 5.6% |
| Cajuns | 6.9 /100 | #222 | Tragic 5.6% |
| Immigrants | Fiji | 6.7 /100 | #223 | Tragic 5.6% |
| Sudanese | 6.4 /100 | #224 | Tragic 5.6% |
| Immigrants | Cambodia | 6.1 /100 | #225 | Tragic 5.6% |
| South Americans | 5.7 /100 | #226 | Tragic 5.6% |
| Immigrants | Zaire | 5.6 /100 | #227 | Tragic 5.6% |
| Arabs | 5.4 /100 | #228 | Tragic 5.7% |
| Sub-Saharan Africans | 4.9 /100 | #229 | Tragic 5.7% |
| Moroccans | 4.9 /100 | #230 | Tragic 5.7% |
| Immigrants | Iraq | 4.4 /100 | #231 | Tragic 5.7% |
| Immigrants | Laos | 4.4 /100 | #232 | Tragic 5.7% |
| Immigrants | Colombia | 3.7 /100 | #233 | Tragic 5.7% |
| Immigrants | Uruguay | 3.7 /100 | #234 | Tragic 5.7% |