Alaska Native vs Macedonian Married-Couple Family Poverty
COMPARE
Alaska Native
Macedonian
Married-Couple Family Poverty
Married-Couple Family Poverty Comparison
Alaska Natives
Macedonians
6.2%
MARRIED-COUPLE FAMILY POVERTY
0.2/ 100
METRIC RATING
268th/ 347
METRIC RANK
4.4%
MARRIED-COUPLE FAMILY POVERTY
99.4/ 100
METRIC RATING
65th/ 347
METRIC RANK
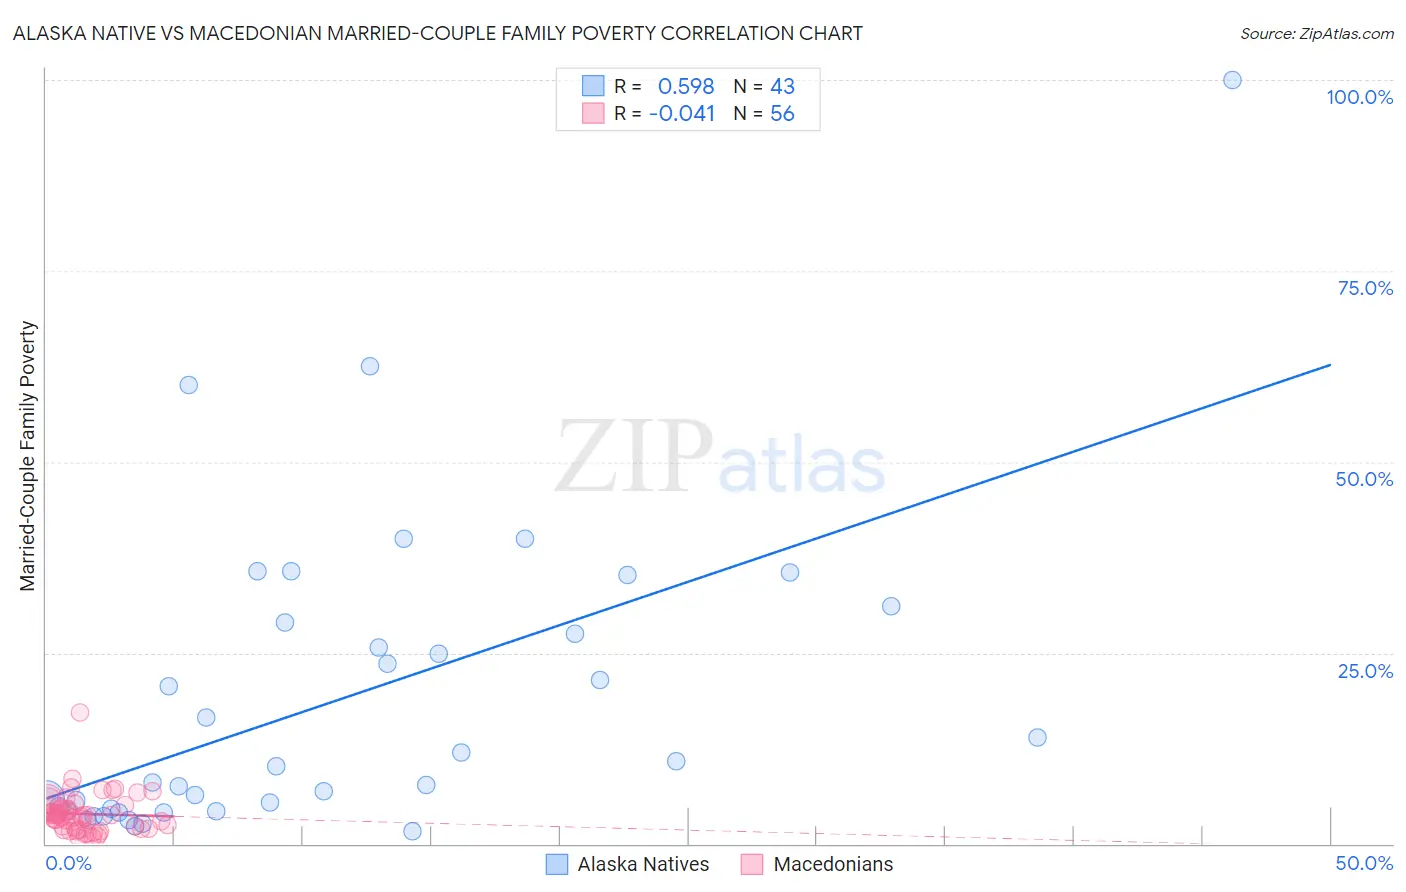
Alaska Native vs Macedonian Married-Couple Family Poverty Correlation Chart
The statistical analysis conducted on geographies consisting of 76,597,225 people shows a substantial positive correlation between the proportion of Alaska Natives and poverty level among married-couple families in the United States with a correlation coefficient (R) of 0.598 and weighted average of 6.2%. Similarly, the statistical analysis conducted on geographies consisting of 132,044,317 people shows no correlation between the proportion of Macedonians and poverty level among married-couple families in the United States with a correlation coefficient (R) of -0.041 and weighted average of 4.4%, a difference of 39.8%.
Married-Couple Family Poverty Correlation Summary
| Measurement | Alaska Native | Macedonian |
| Minimum | 1.6% | 0.82% |
| Maximum | 100.0% | 17.2% |
| Range | 98.4% | 16.3% |
| Mean | 18.9% | 3.9% |
| Median | 10.2% | 3.7% |
| Interquartile 25% (IQ1) | 4.3% | 2.0% |
| Interquartile 75% (IQ3) | 28.9% | 4.7% |
| Interquartile Range (IQR) | 24.6% | 2.7% |
| Standard Deviation (Sample) | 20.2% | 2.6% |
| Standard Deviation (Population) | 19.9% | 2.6% |
Similar Demographics by Married-Couple Family Poverty
Demographics Similar to Alaska Natives by Married-Couple Family Poverty
In terms of married-couple family poverty, the demographic groups most similar to Alaska Natives are Immigrants from West Indies (6.2%, a difference of 0.17%), Immigrants from Jamaica (6.2%, a difference of 0.21%), Immigrants from Bahamas (6.2%, a difference of 0.43%), Trinidadian and Tobagonian (6.2%, a difference of 0.46%), and Spanish American (6.2%, a difference of 0.48%).
| Demographics | Rating | Rank | Married-Couple Family Poverty |
| Senegalese | 0.3 /100 | #261 | Tragic 6.1% |
| Shoshone | 0.3 /100 | #262 | Tragic 6.1% |
| Immigrants | Senegal | 0.3 /100 | #263 | Tragic 6.1% |
| Immigrants | Congo | 0.2 /100 | #264 | Tragic 6.1% |
| Blackfeet | 0.2 /100 | #265 | Tragic 6.2% |
| Creek | 0.2 /100 | #266 | Tragic 6.2% |
| Spanish Americans | 0.2 /100 | #267 | Tragic 6.2% |
| Alaska Natives | 0.2 /100 | #268 | Tragic 6.2% |
| Immigrants | West Indies | 0.1 /100 | #269 | Tragic 6.2% |
| Immigrants | Jamaica | 0.1 /100 | #270 | Tragic 6.2% |
| Immigrants | Bahamas | 0.1 /100 | #271 | Tragic 6.2% |
| Trinidadians and Tobagonians | 0.1 /100 | #272 | Tragic 6.2% |
| Colville | 0.1 /100 | #273 | Tragic 6.3% |
| Barbadians | 0.1 /100 | #274 | Tragic 6.3% |
| Choctaw | 0.1 /100 | #275 | Tragic 6.3% |
Demographics Similar to Macedonians by Married-Couple Family Poverty
In terms of married-couple family poverty, the demographic groups most similar to Macedonians are Immigrants from Serbia (4.4%, a difference of 0.13%), Immigrants from Canada (4.4%, a difference of 0.18%), Slavic (4.4%, a difference of 0.19%), New Zealander (4.4%, a difference of 0.20%), and Immigrants from Korea (4.5%, a difference of 0.34%).
| Demographics | Rating | Rank | Married-Couple Family Poverty |
| Czechoslovakians | 99.7 /100 | #58 | Exceptional 4.4% |
| Immigrants | Sweden | 99.6 /100 | #59 | Exceptional 4.4% |
| Tlingit-Haida | 99.6 /100 | #60 | Exceptional 4.4% |
| Okinawans | 99.6 /100 | #61 | Exceptional 4.4% |
| Immigrants | Australia | 99.6 /100 | #62 | Exceptional 4.4% |
| Immigrants | Sri Lanka | 99.6 /100 | #63 | Exceptional 4.4% |
| Immigrants | Bulgaria | 99.5 /100 | #64 | Exceptional 4.4% |
| Macedonians | 99.4 /100 | #65 | Exceptional 4.4% |
| Immigrants | Serbia | 99.4 /100 | #66 | Exceptional 4.4% |
| Immigrants | Canada | 99.4 /100 | #67 | Exceptional 4.4% |
| Slavs | 99.4 /100 | #68 | Exceptional 4.4% |
| New Zealanders | 99.4 /100 | #69 | Exceptional 4.4% |
| Immigrants | Korea | 99.4 /100 | #70 | Exceptional 4.5% |
| Immigrants | North America | 99.3 /100 | #71 | Exceptional 4.5% |
| Immigrants | England | 99.3 /100 | #72 | Exceptional 4.5% |